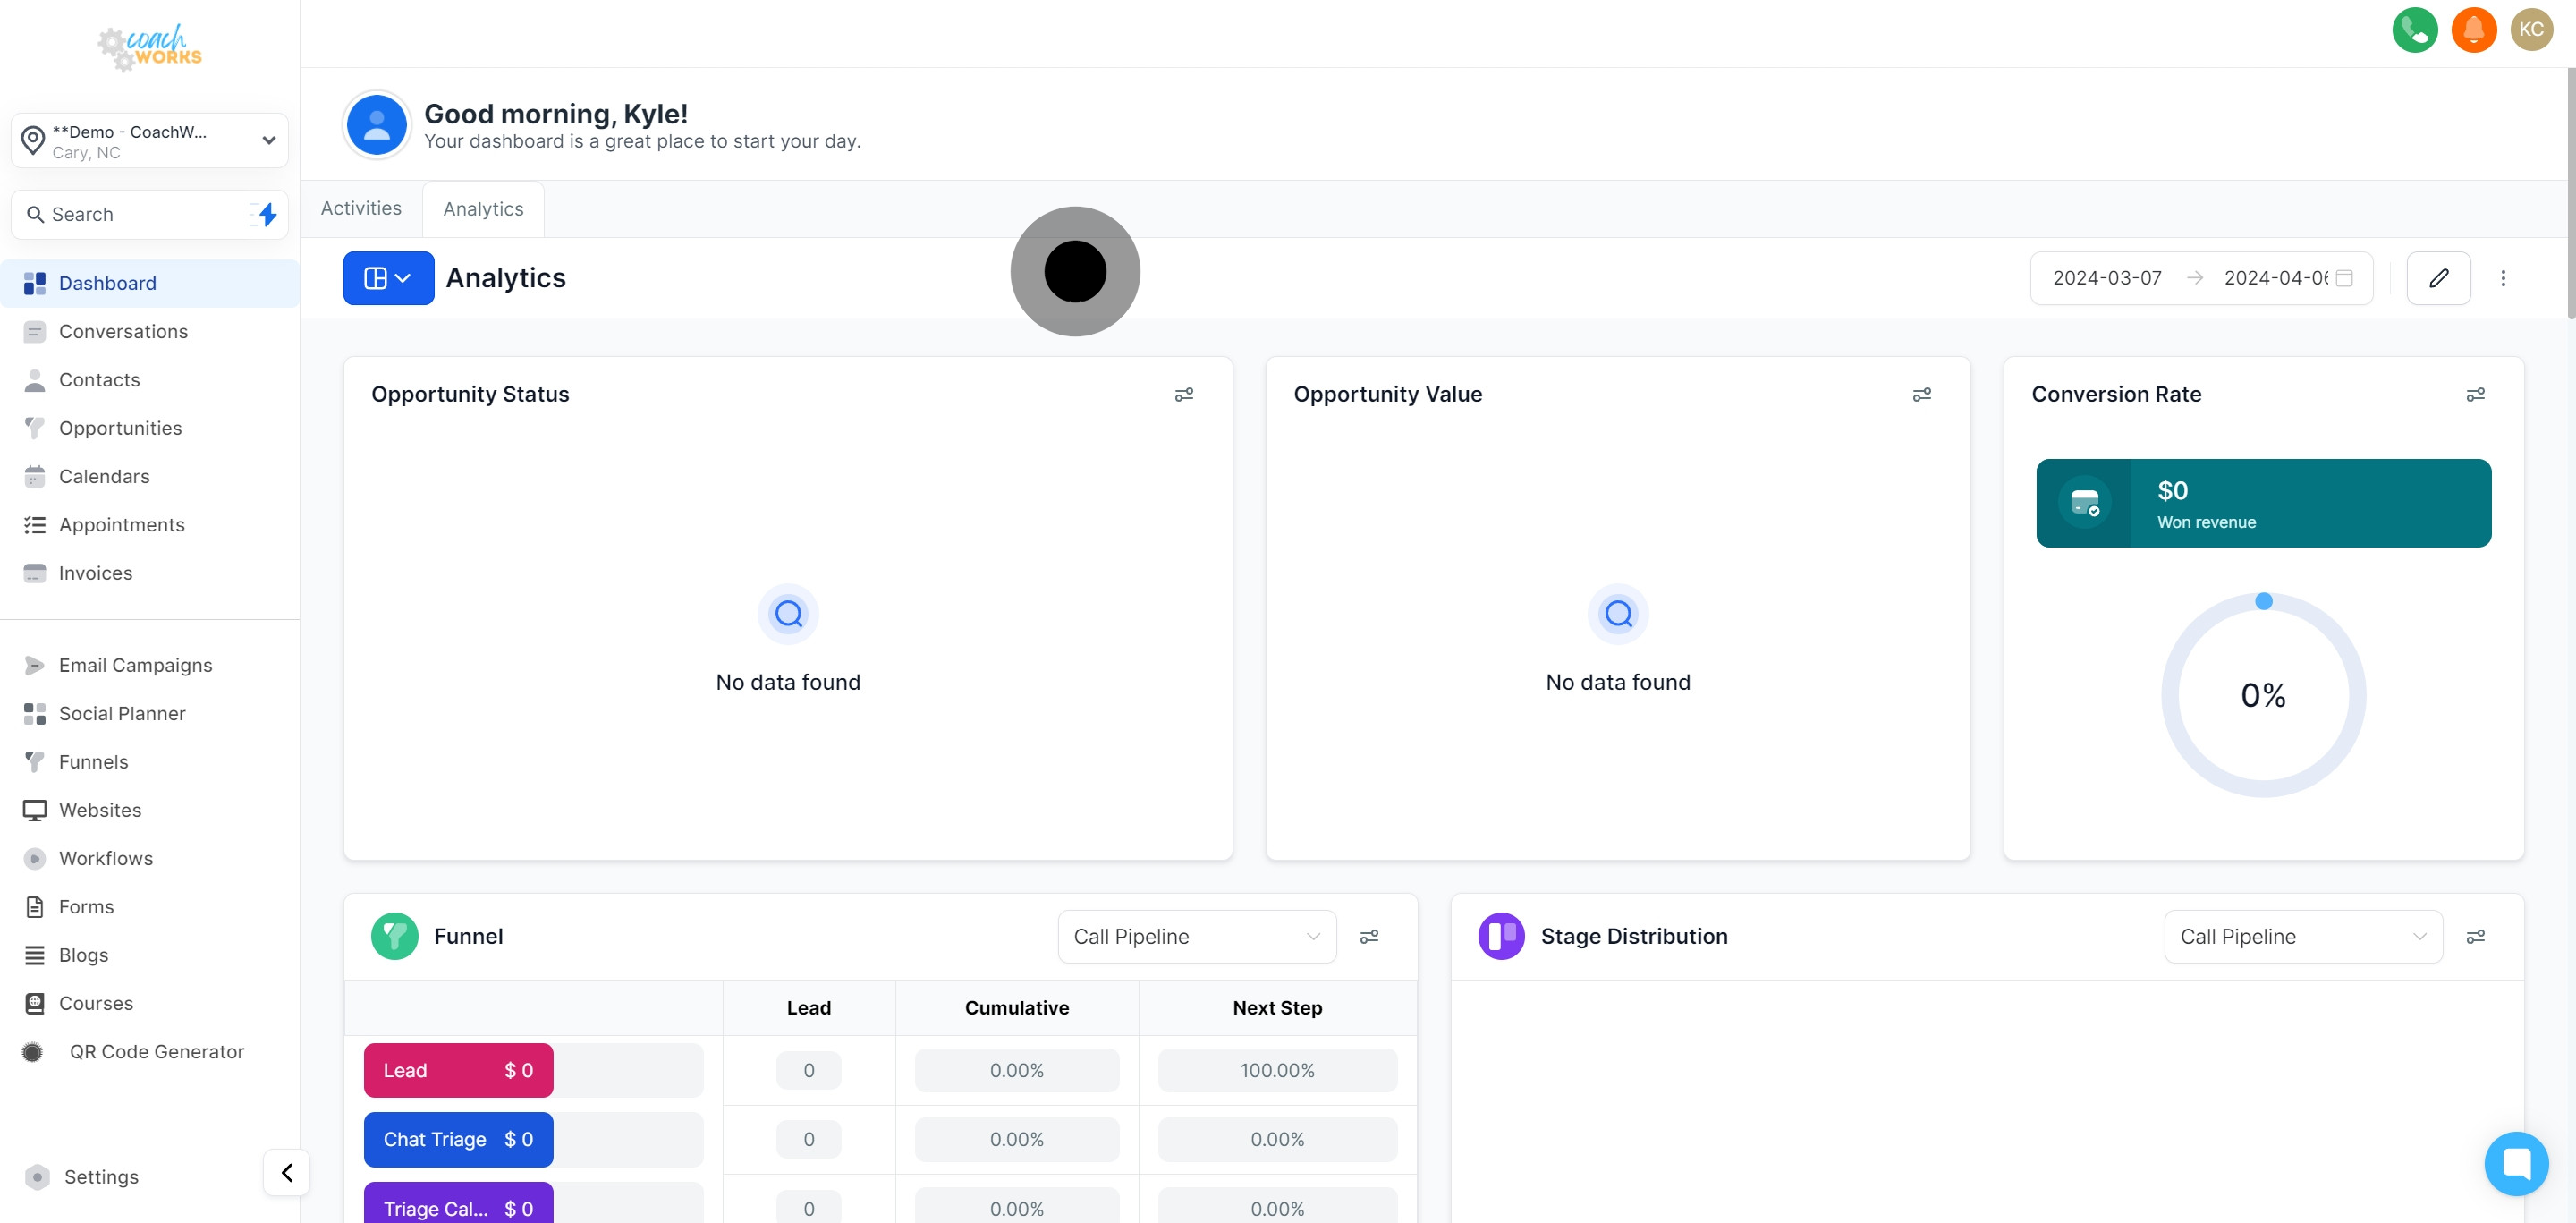
To begin, click on the "analytics" section from your dashboard. This is your portal to understanding your marketing performance.
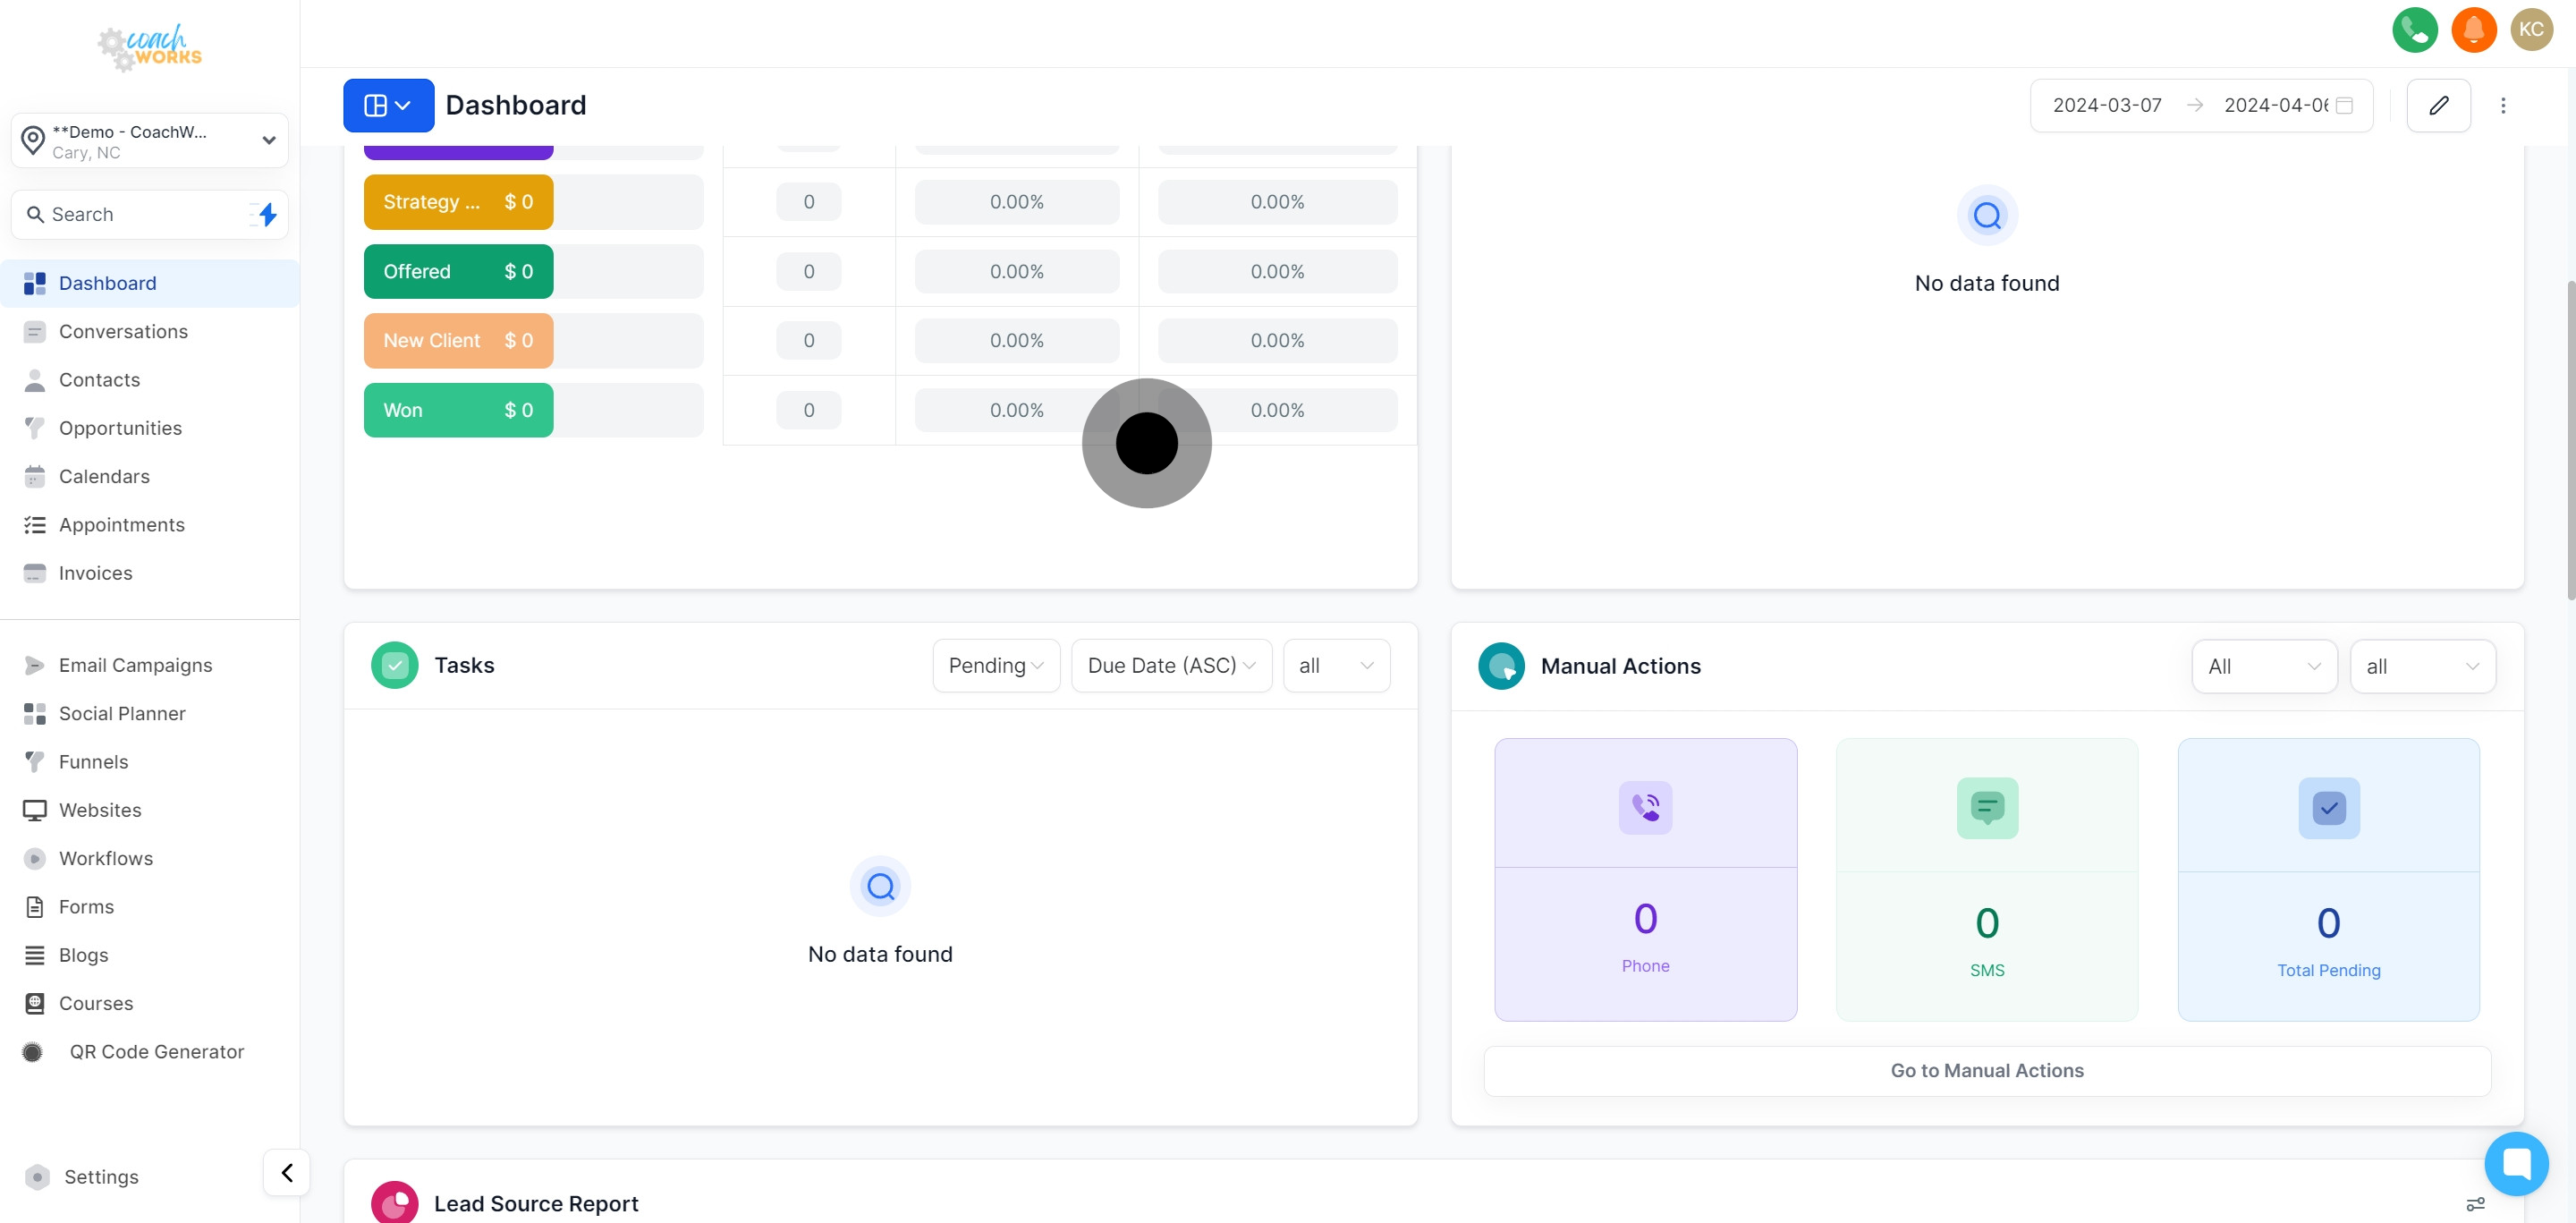
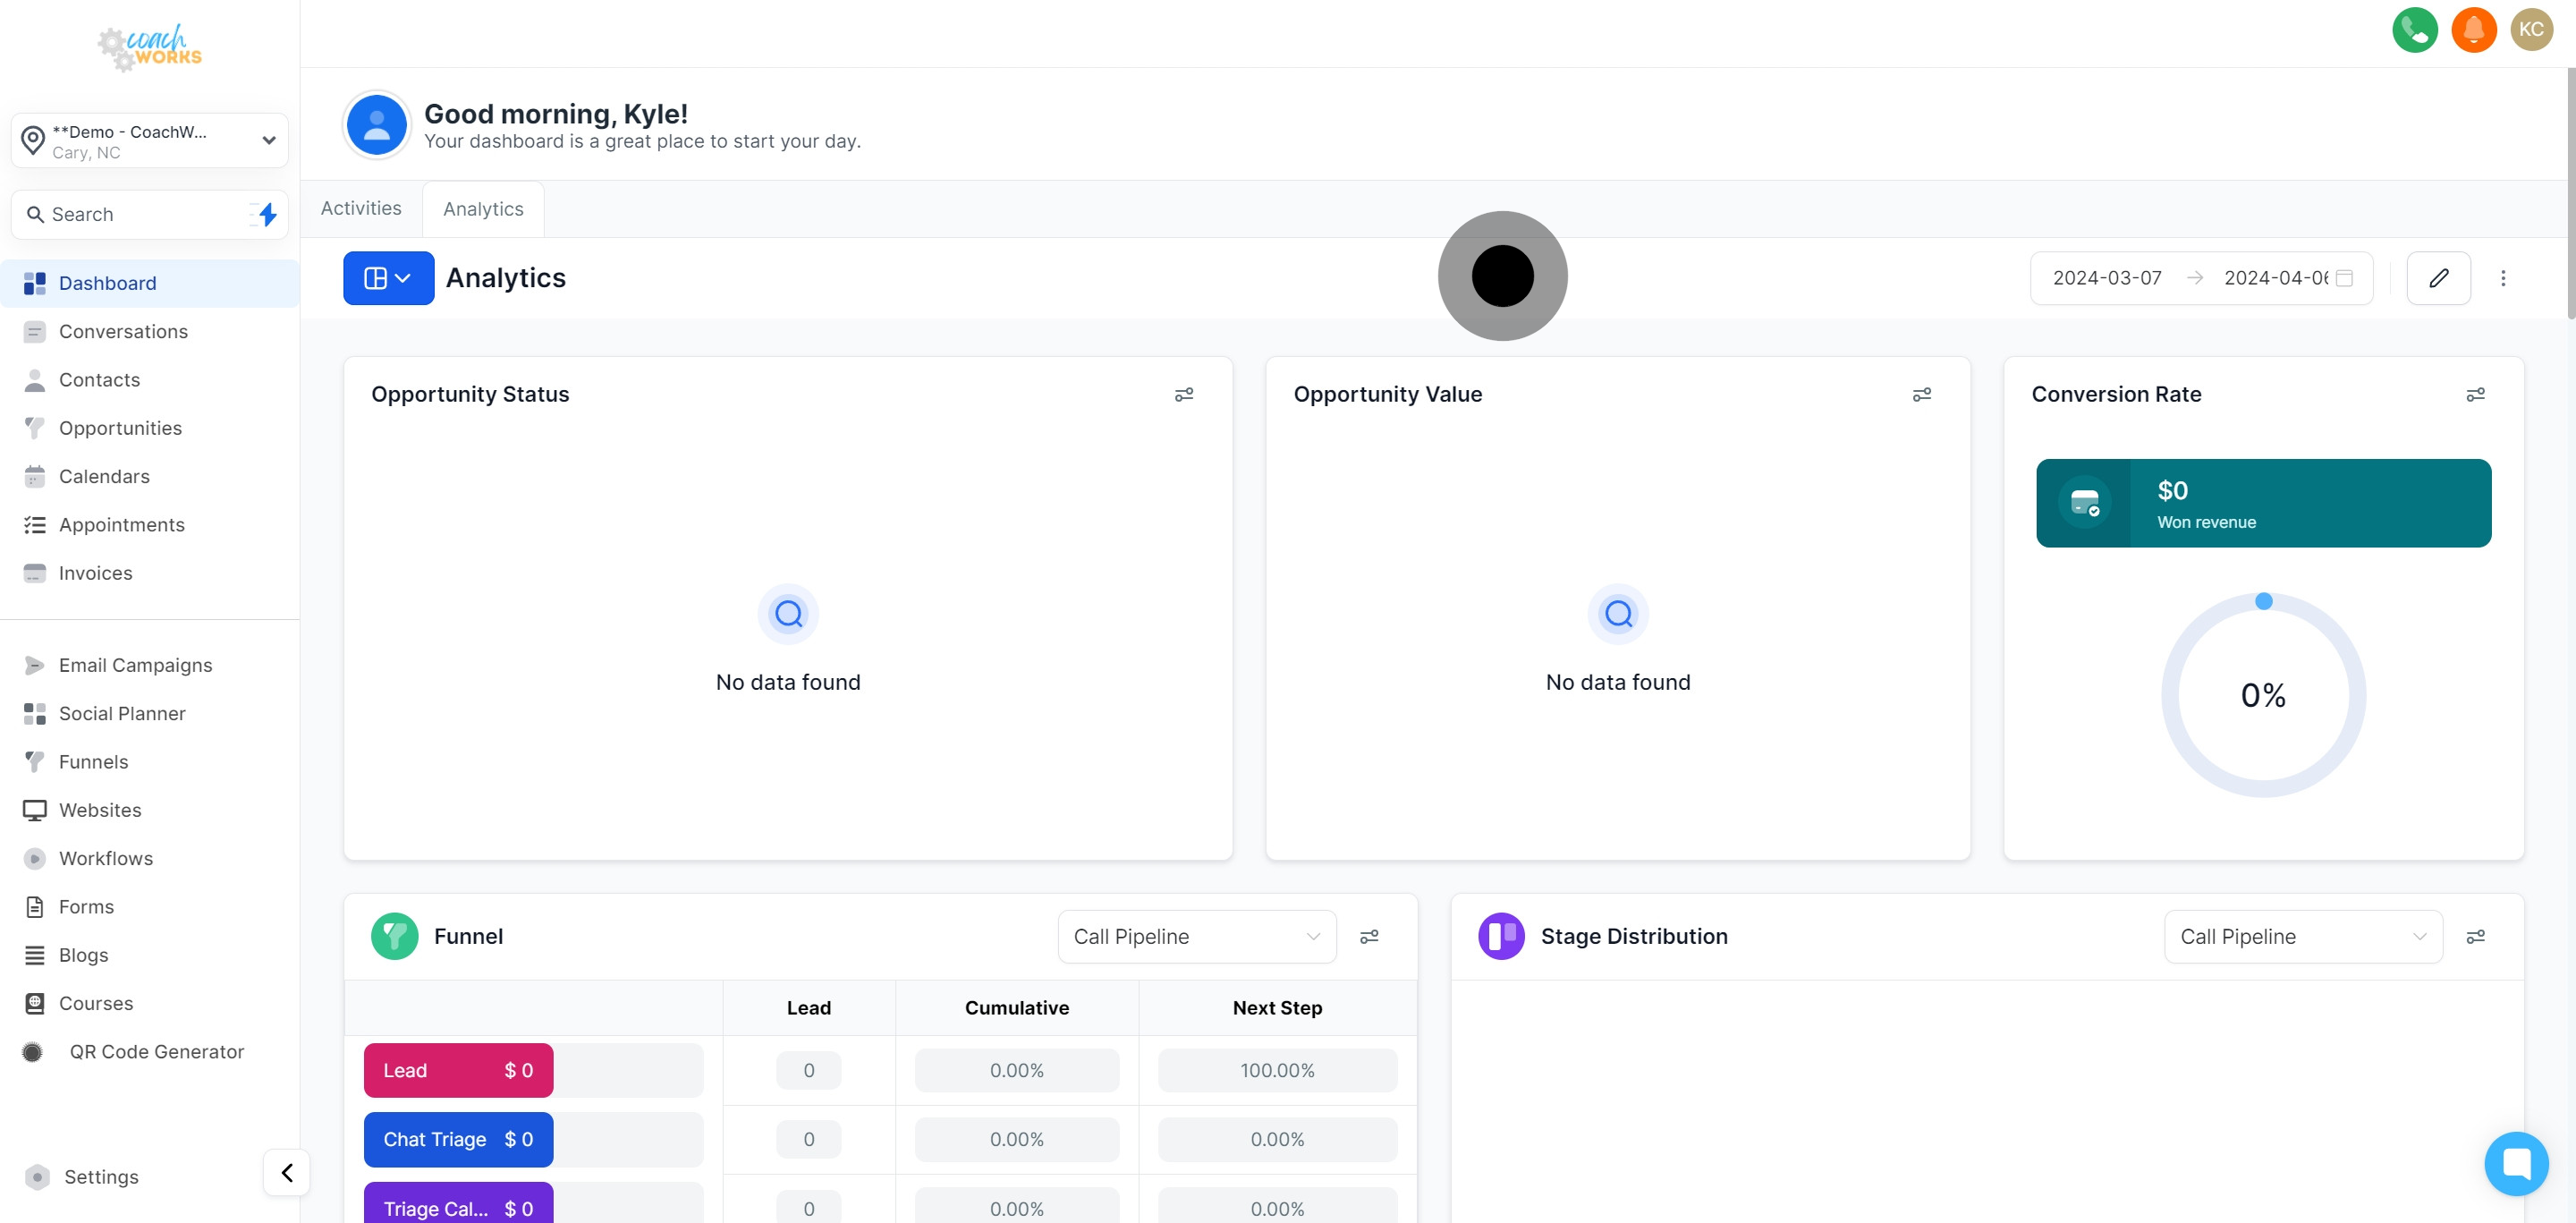
Evaluate the current status of your opportunities by clicking within the opportunities section. This gives you an overview of potential revenue and client engagement.
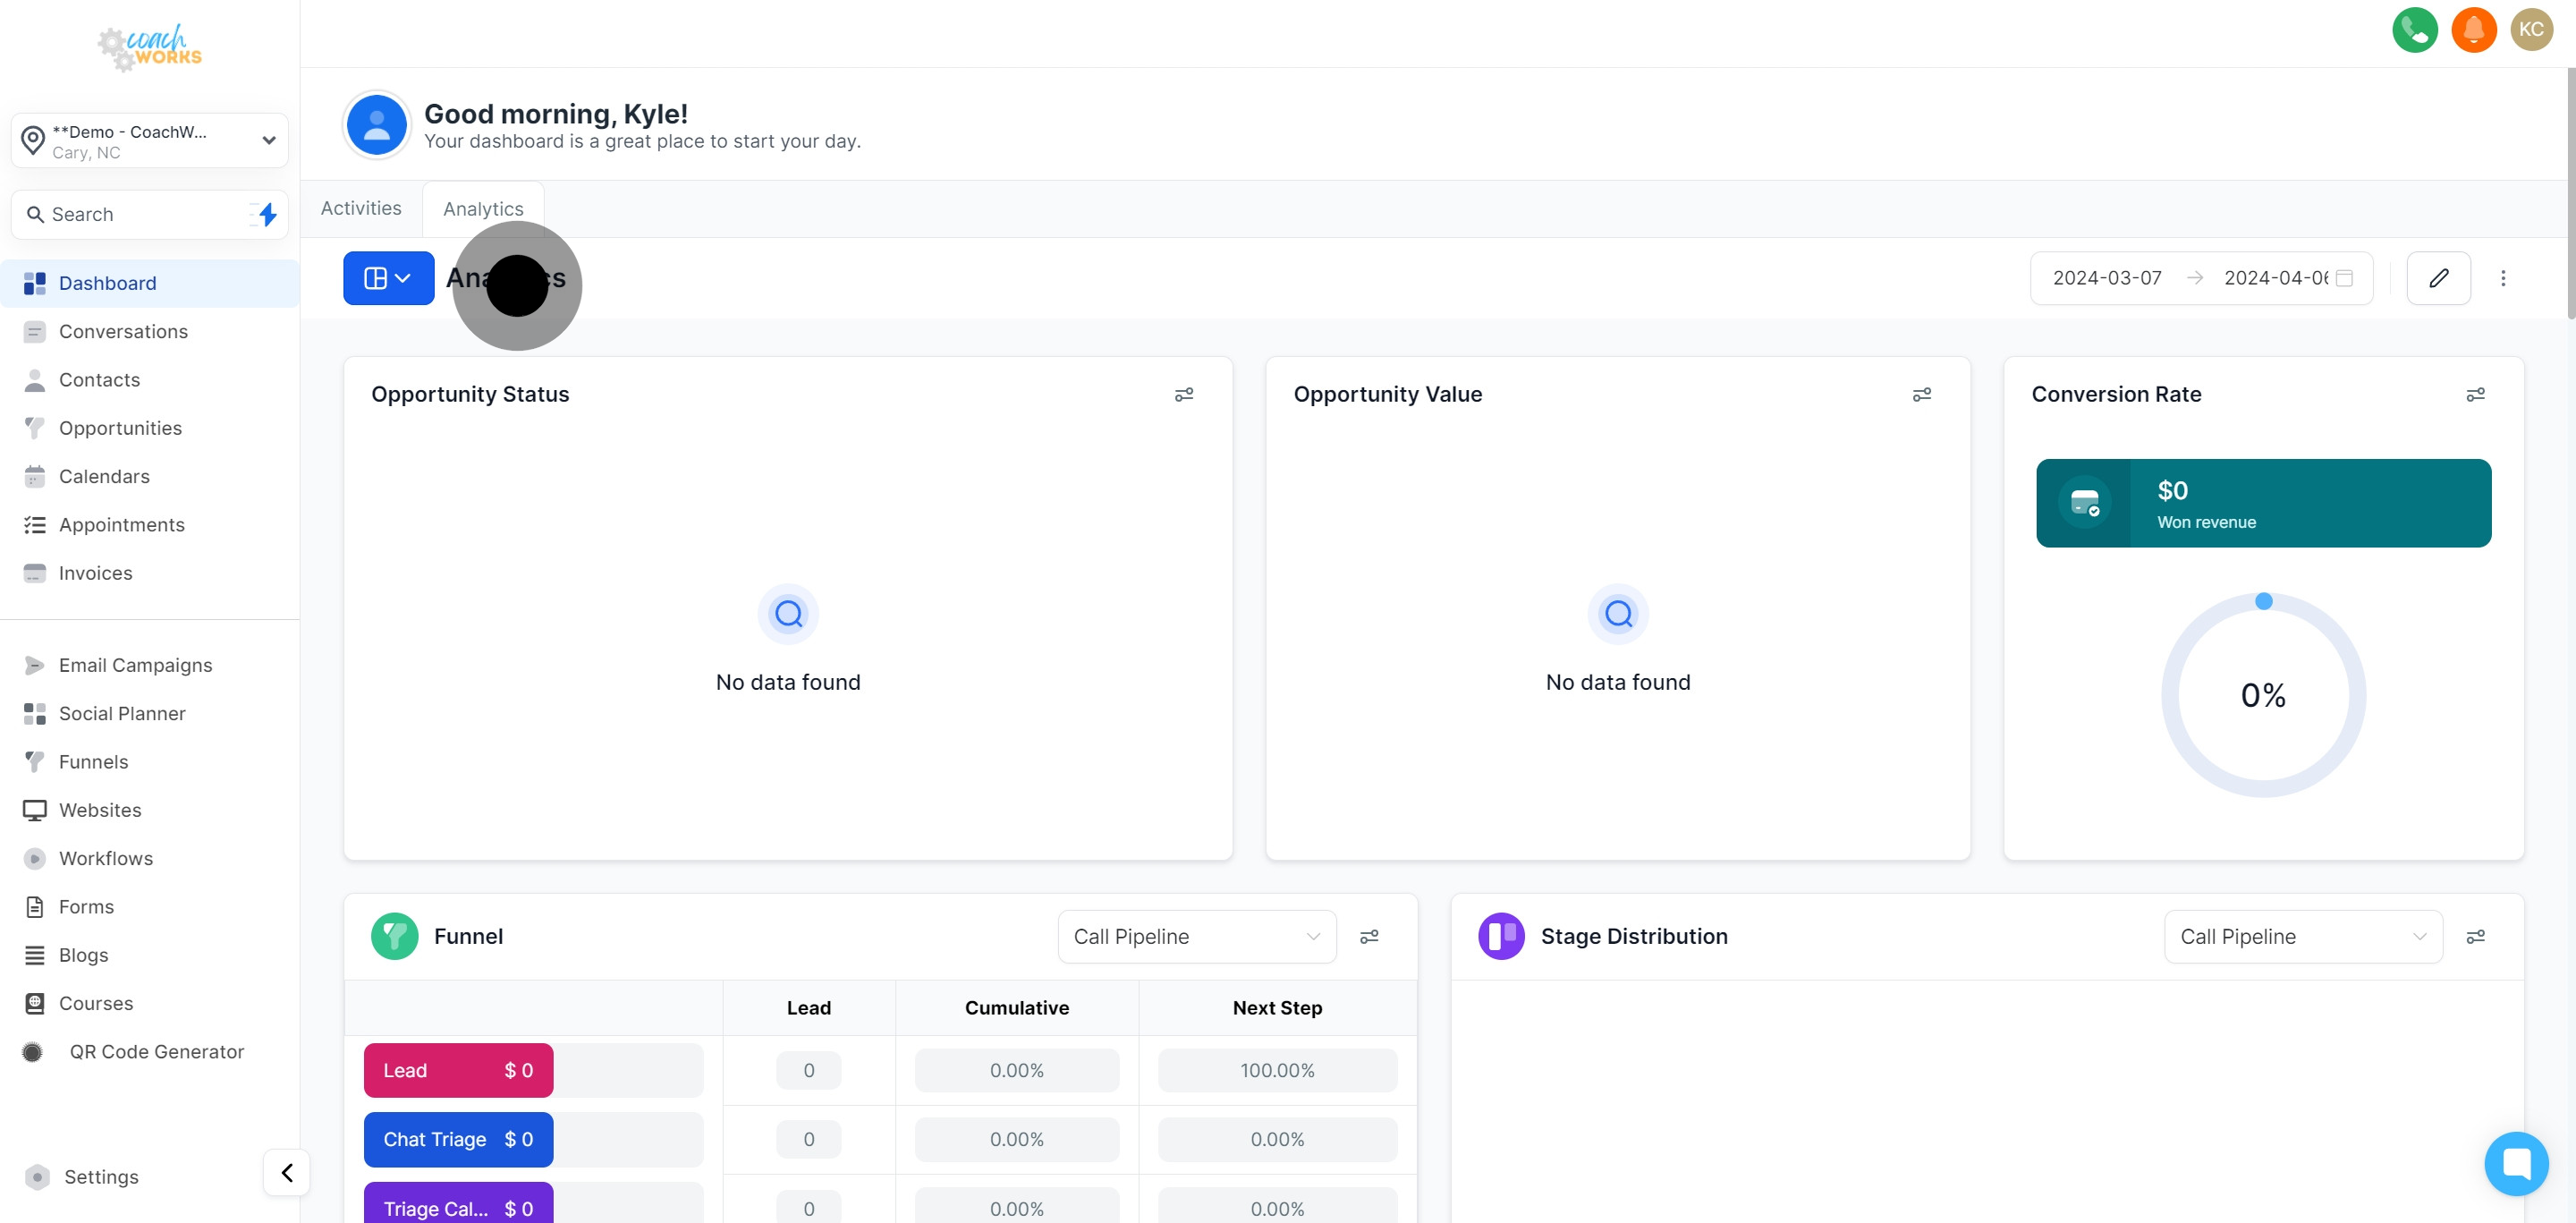
Dig deeper into the value specifics under opportunities to get a grasp on the financial potential of your engagements.
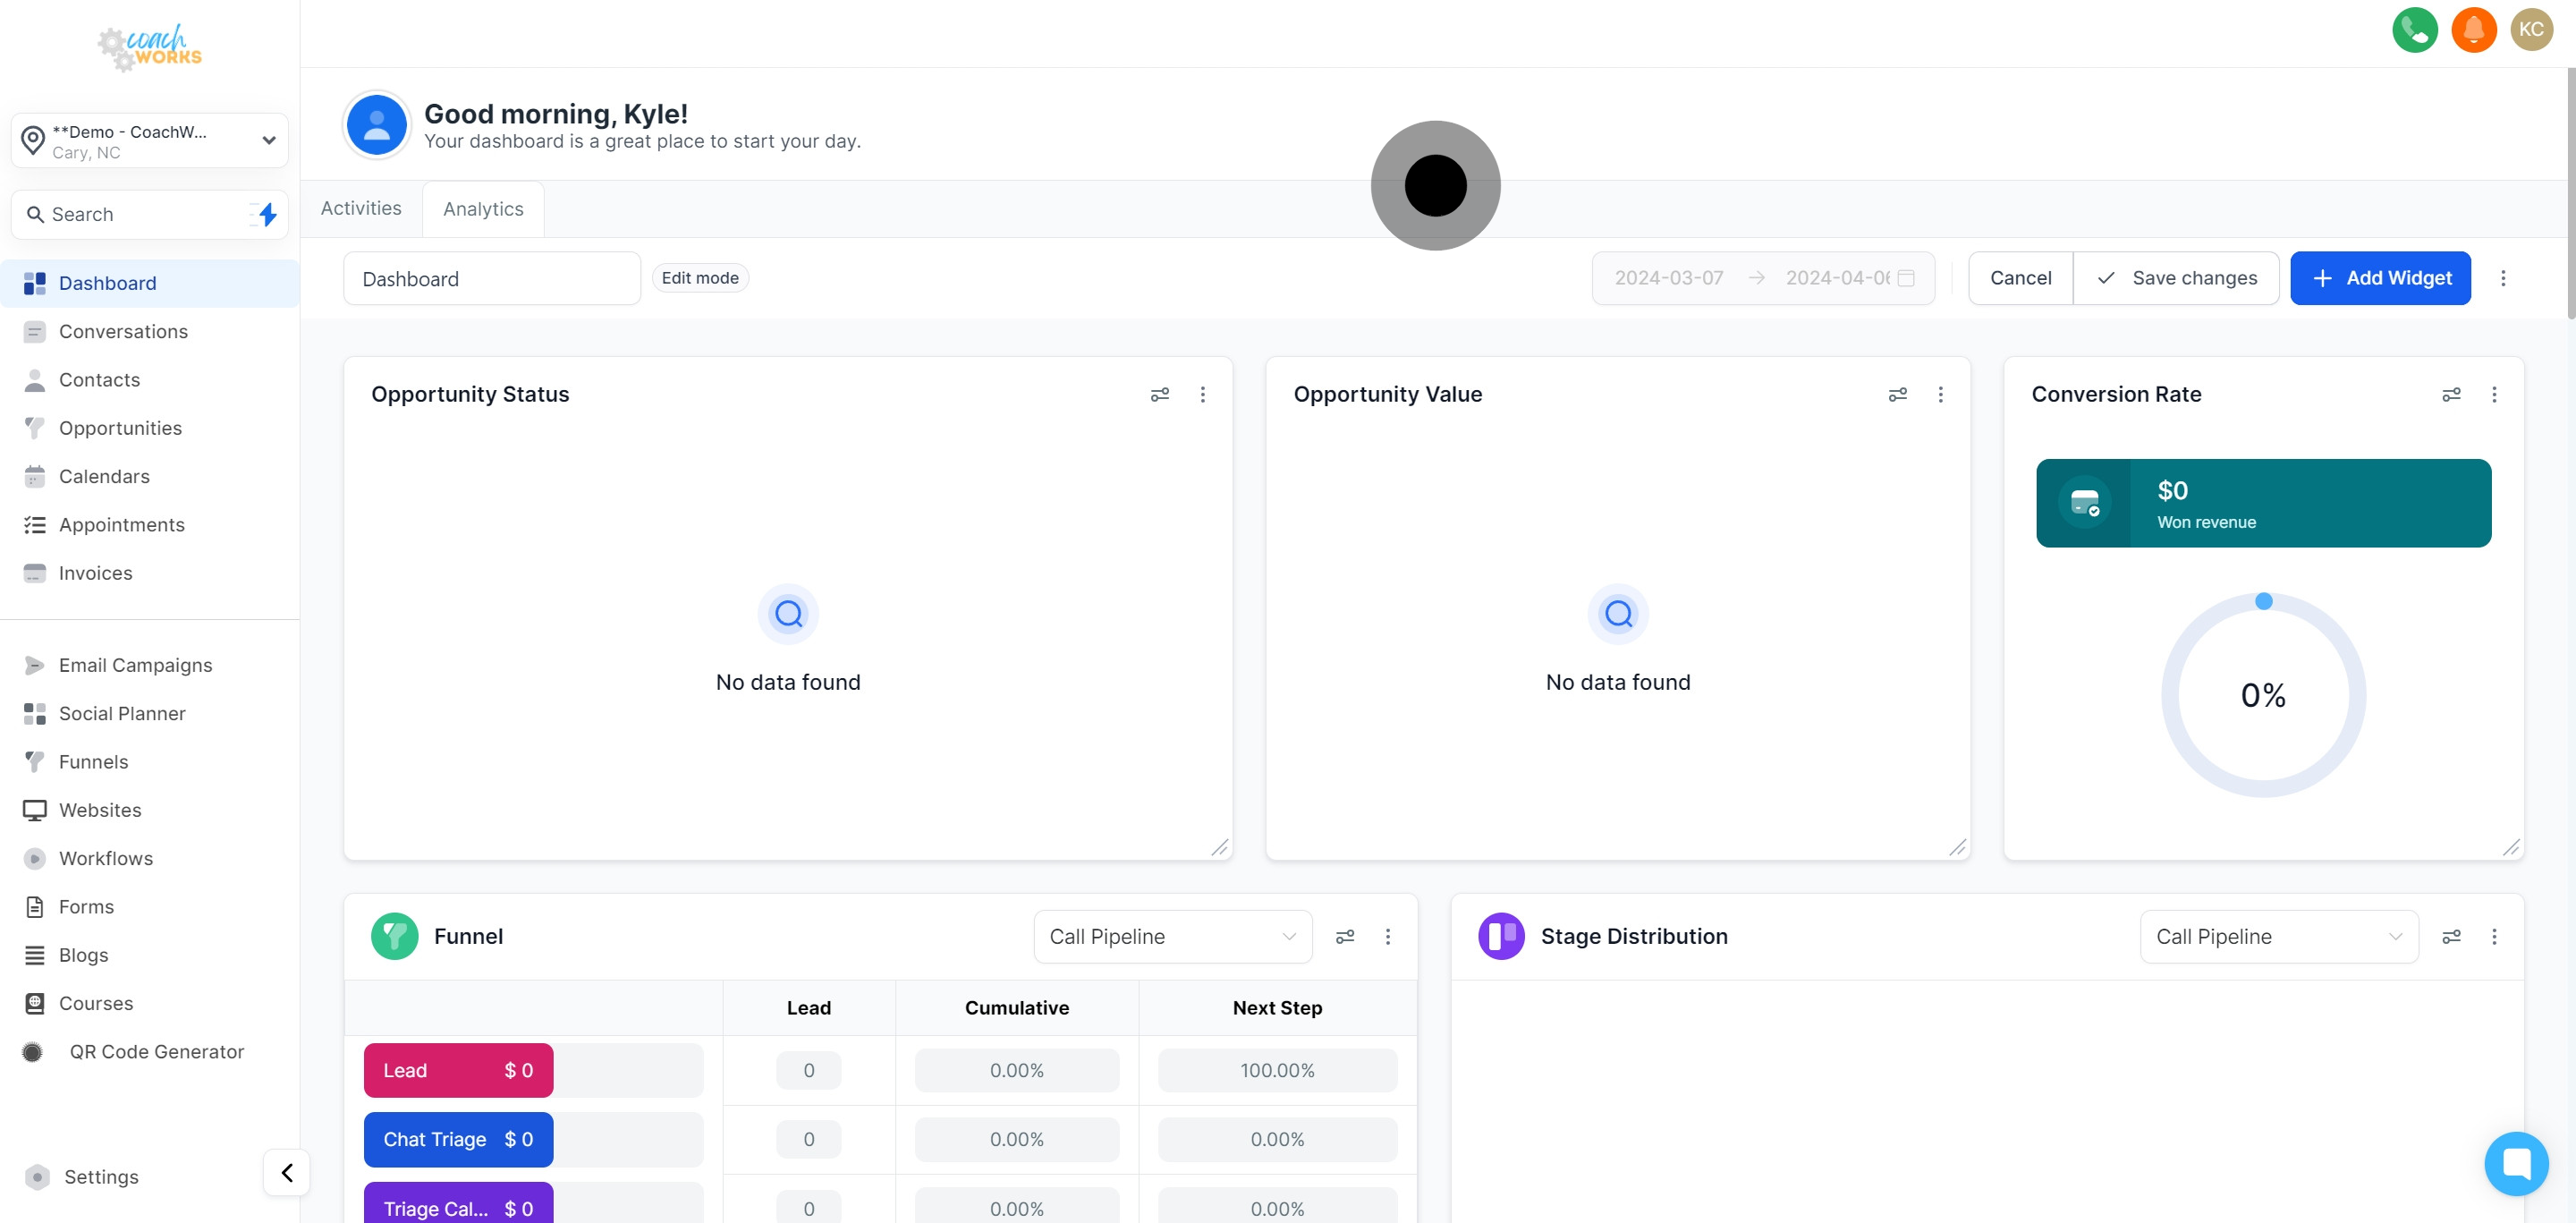
Take note of the conversion rates data to understand how effectively your leads are converting into customers.
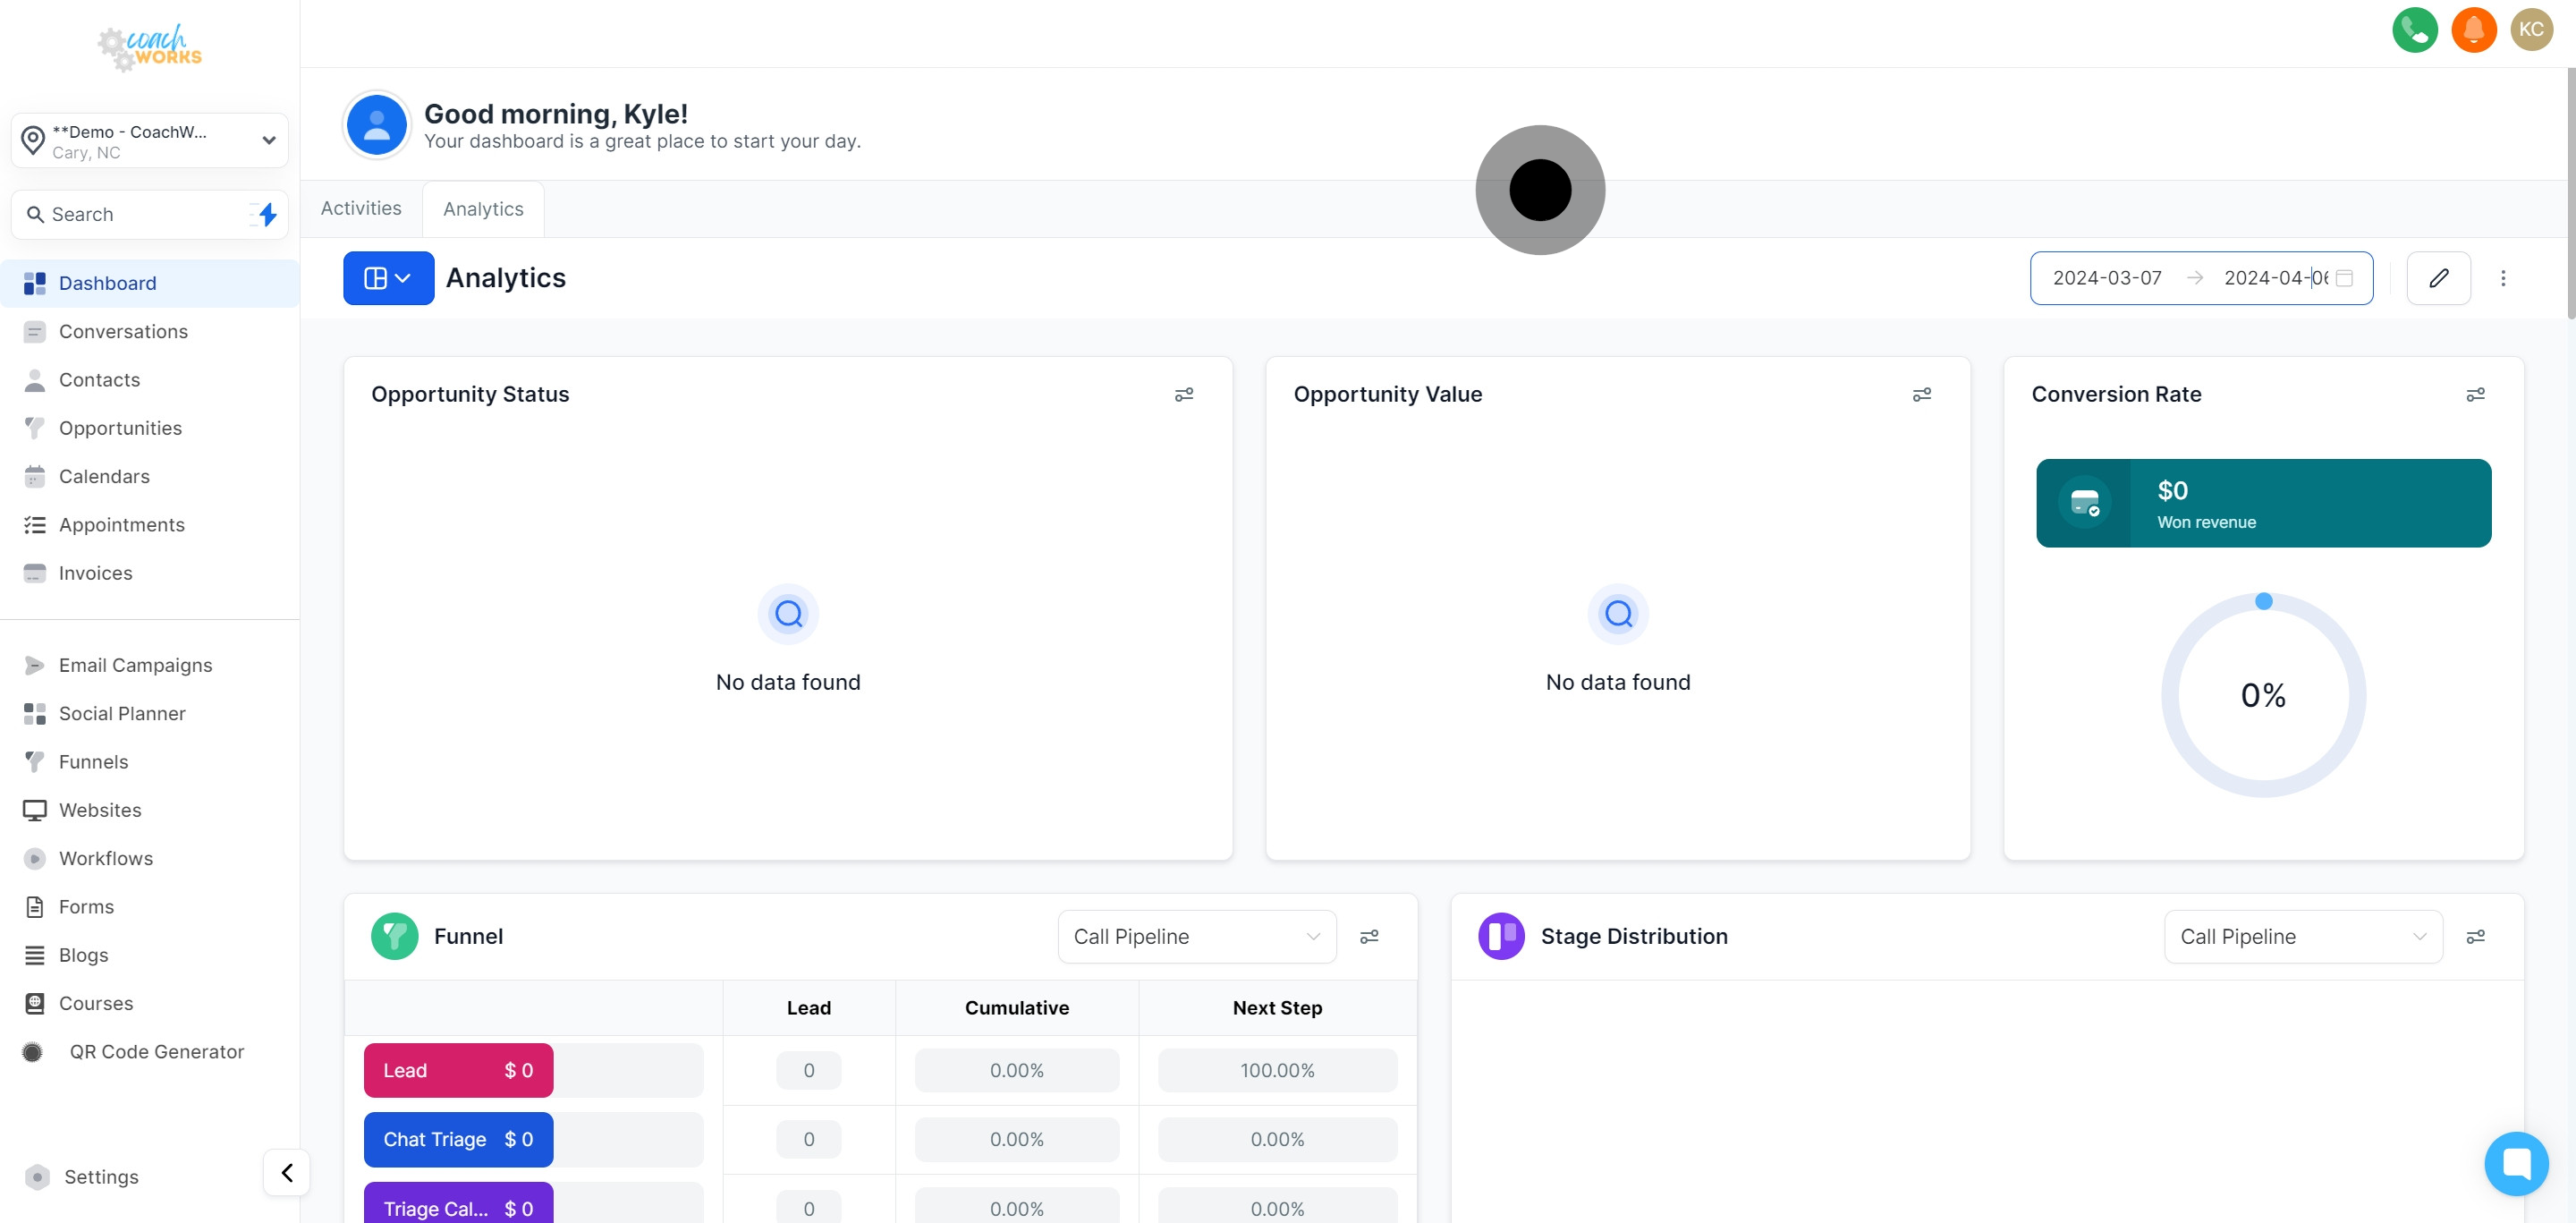
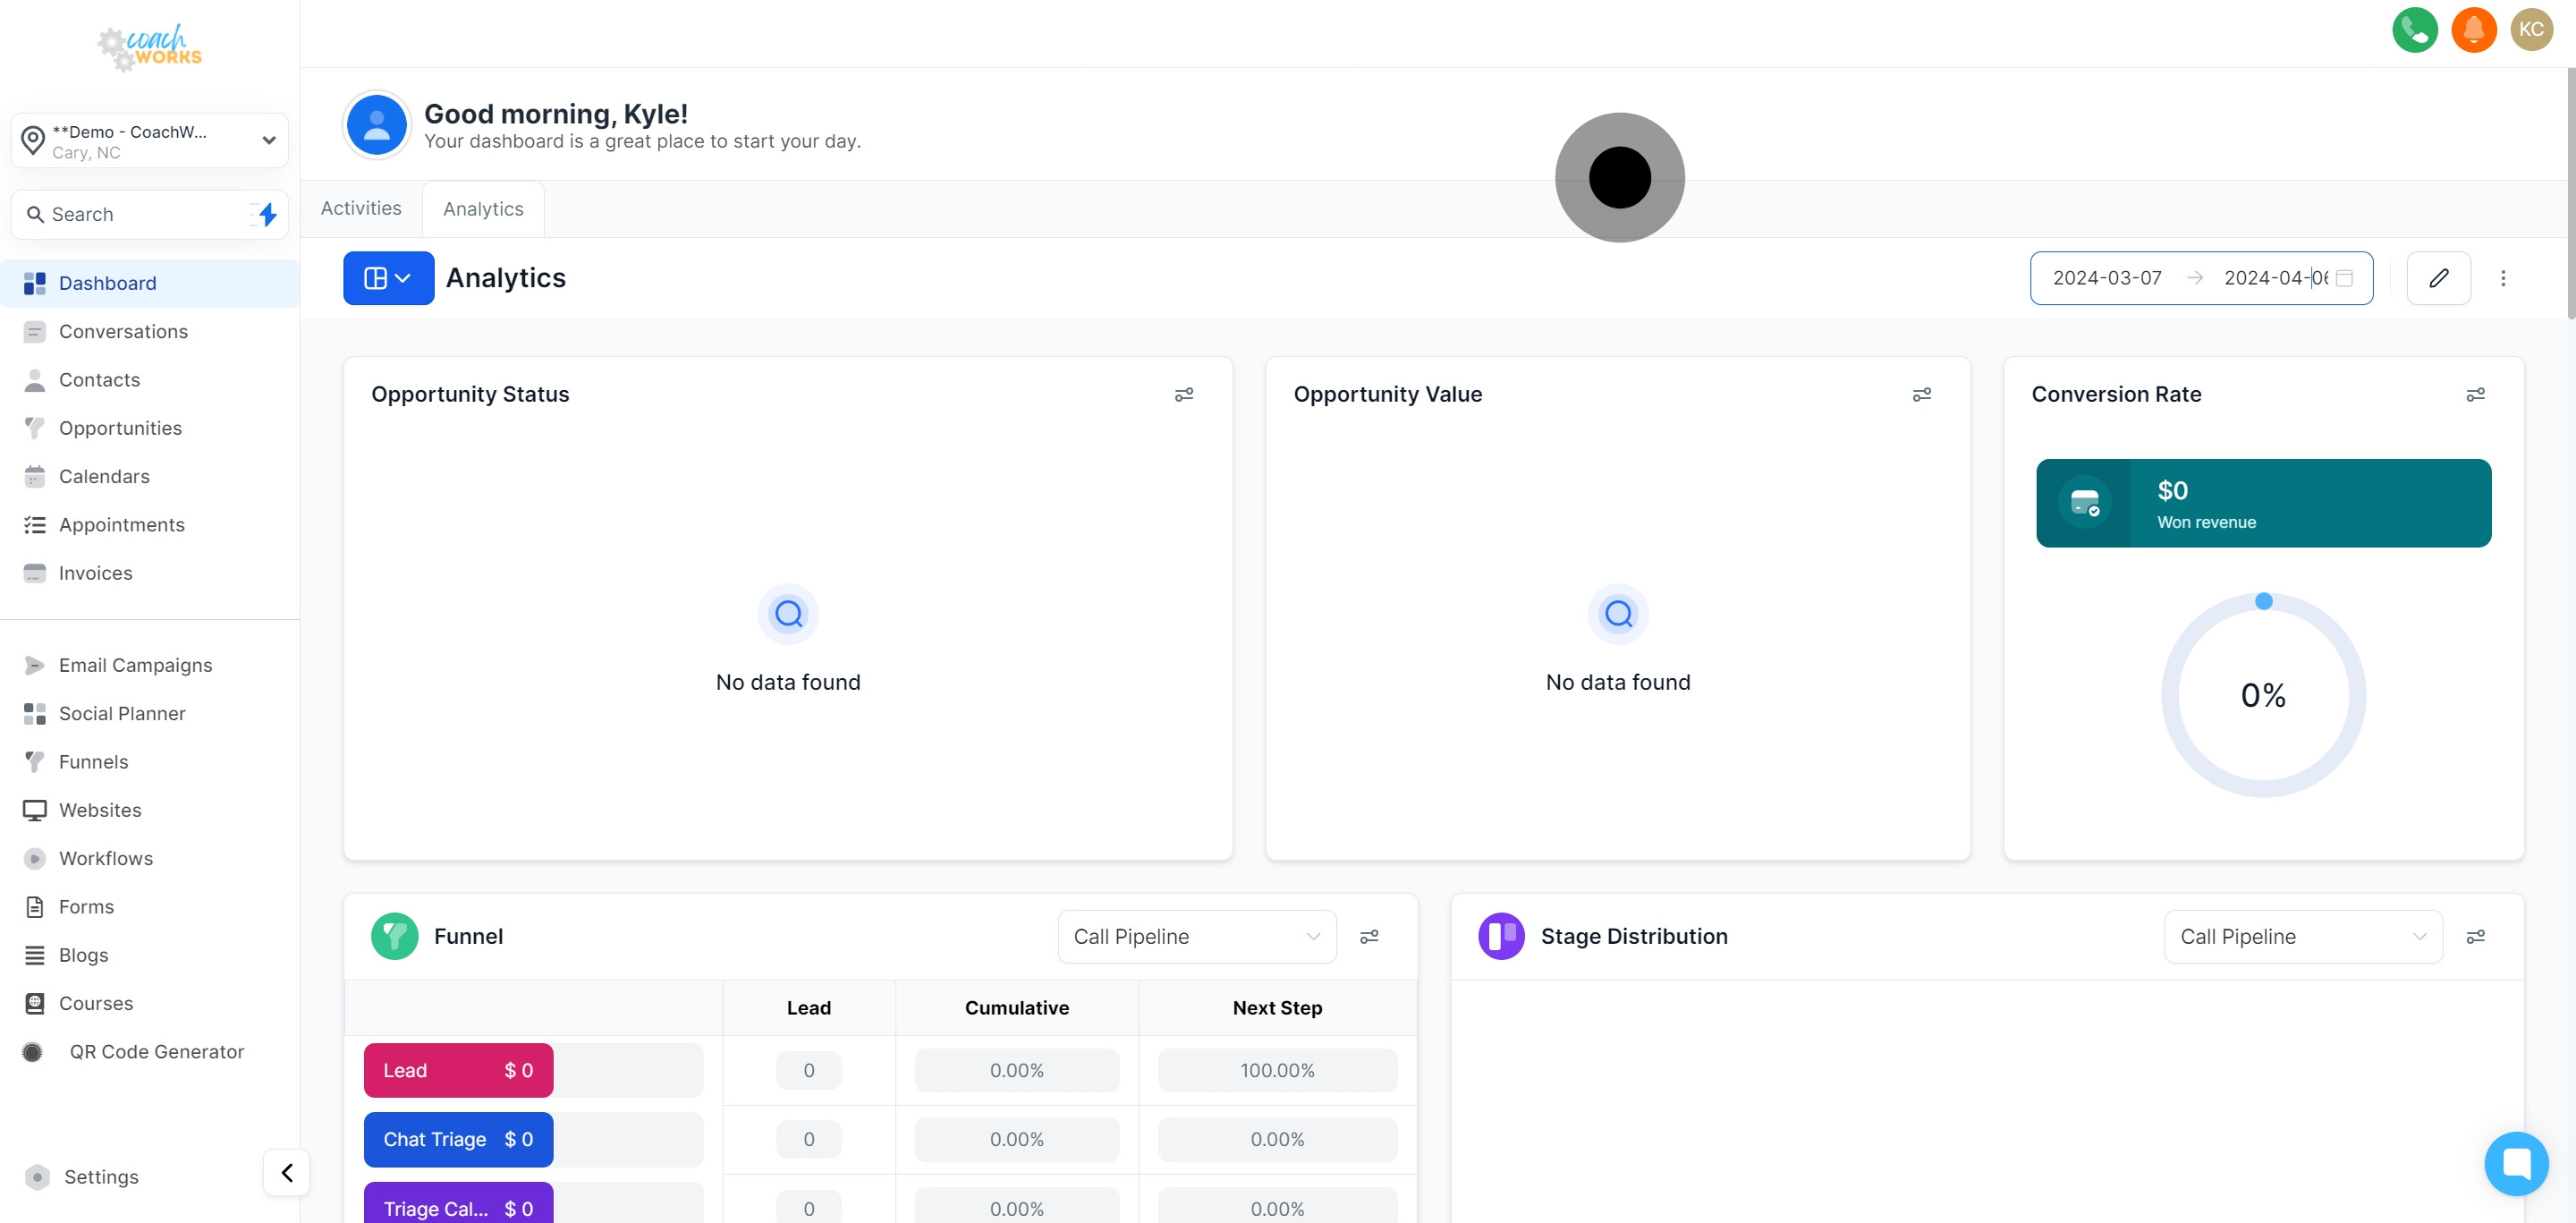
For a more targeted analysis, filter your results by specific dates. This is useful for performance review over particular periods.
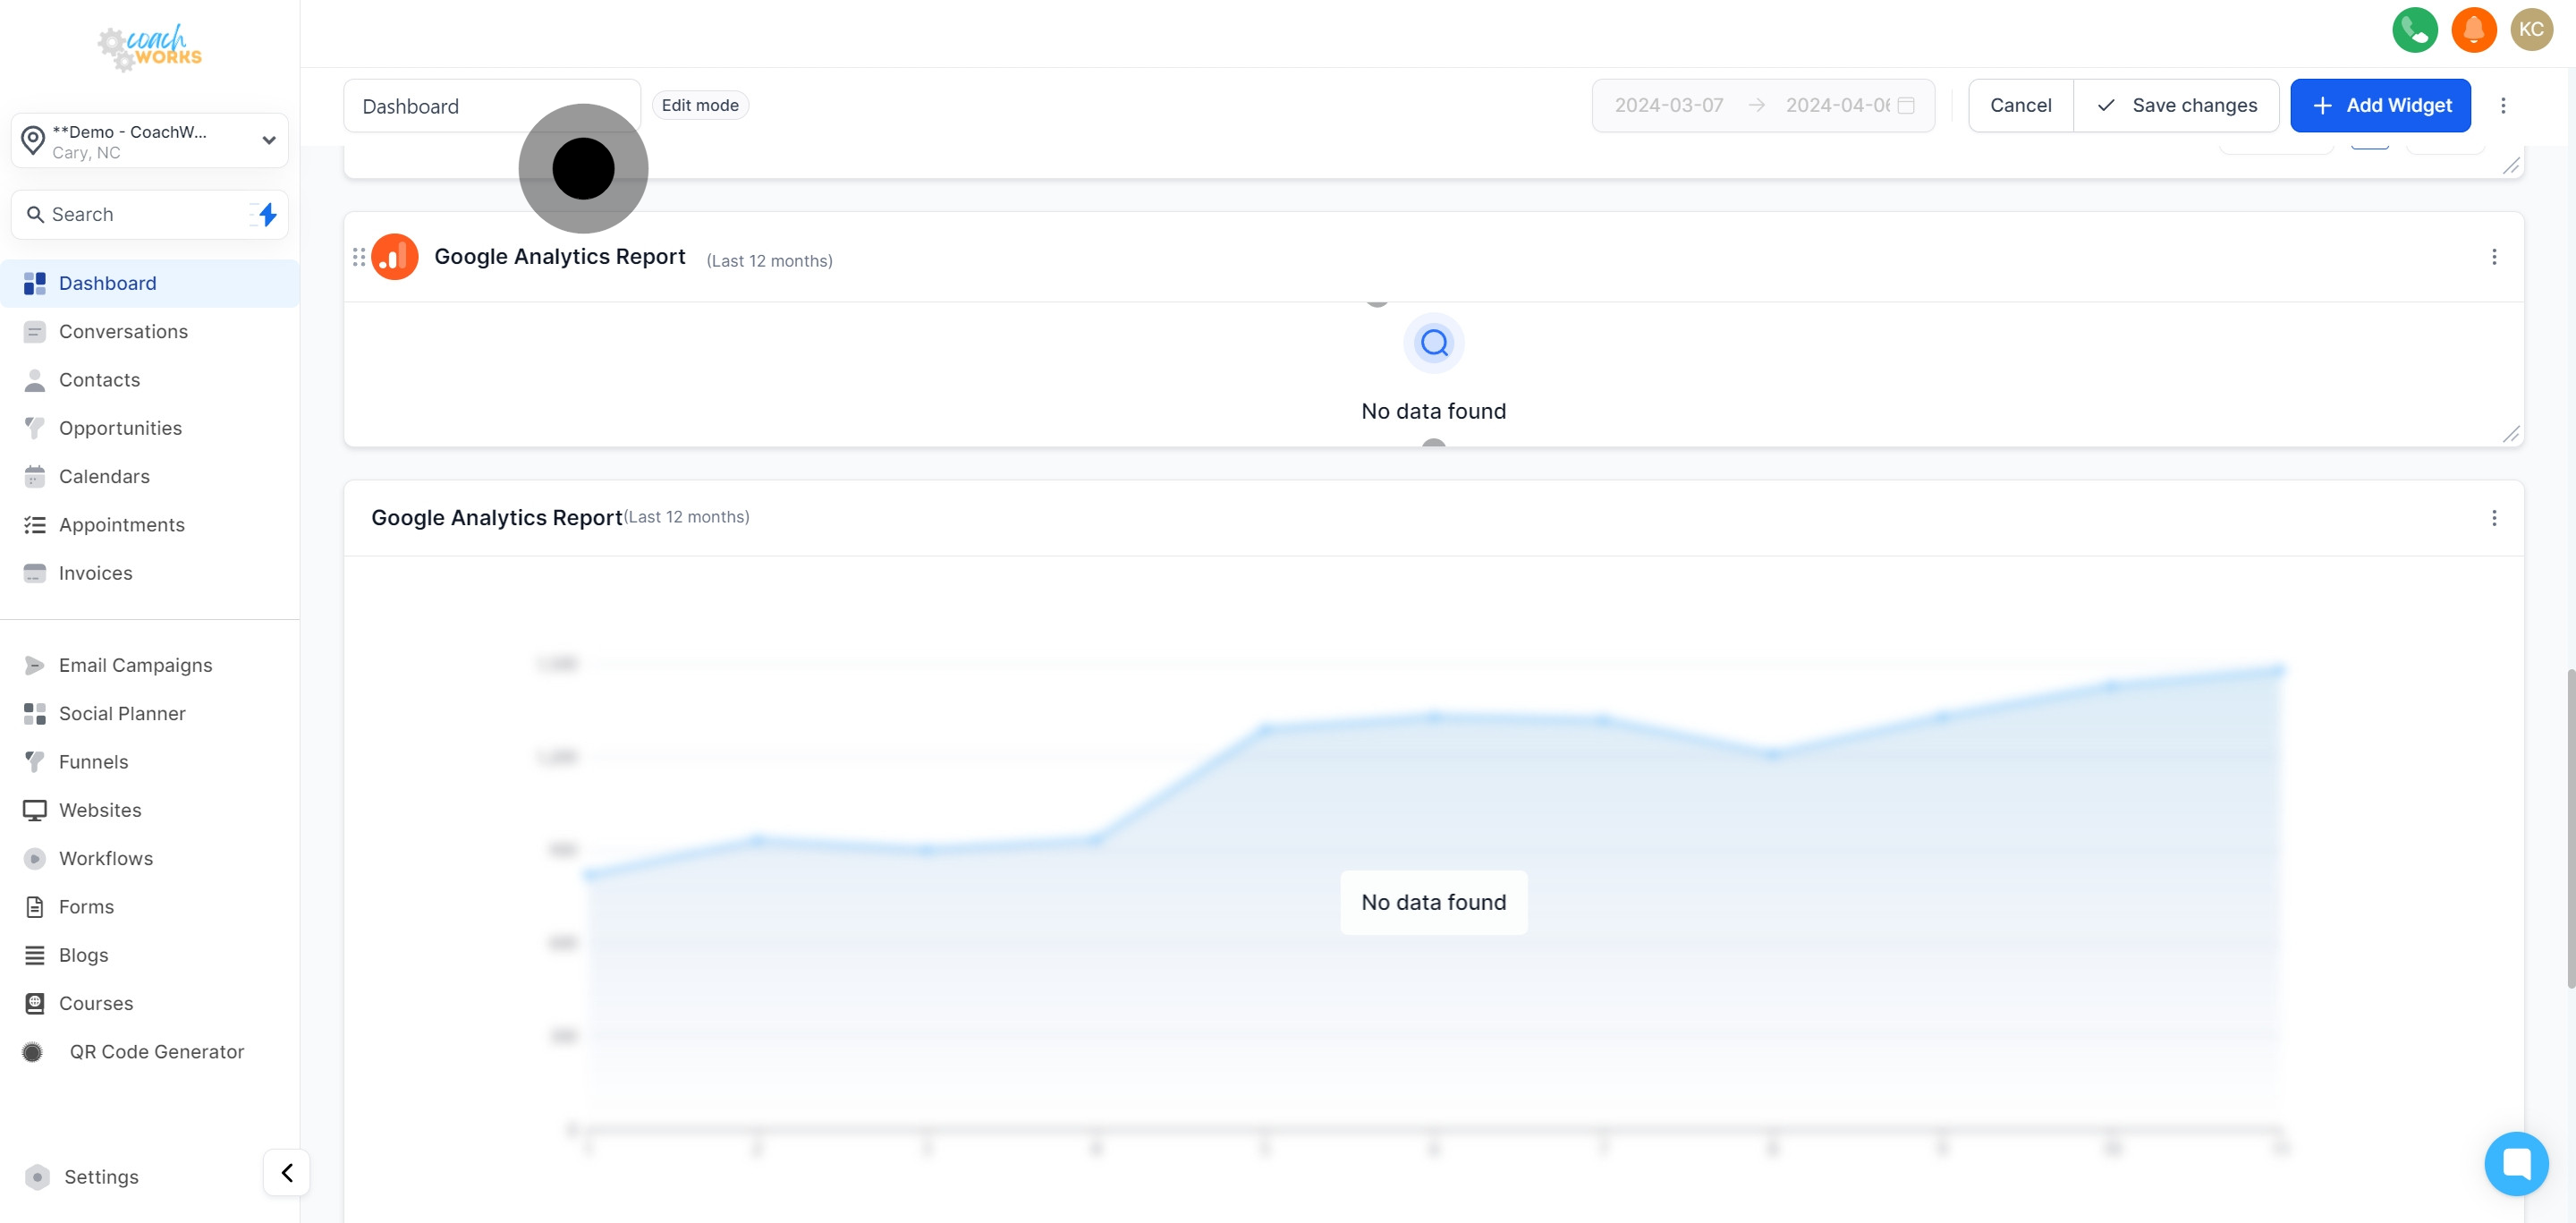
Unleash the power of customization with the editing tool, enabling you to tailor the analytics dashboard to your needs.
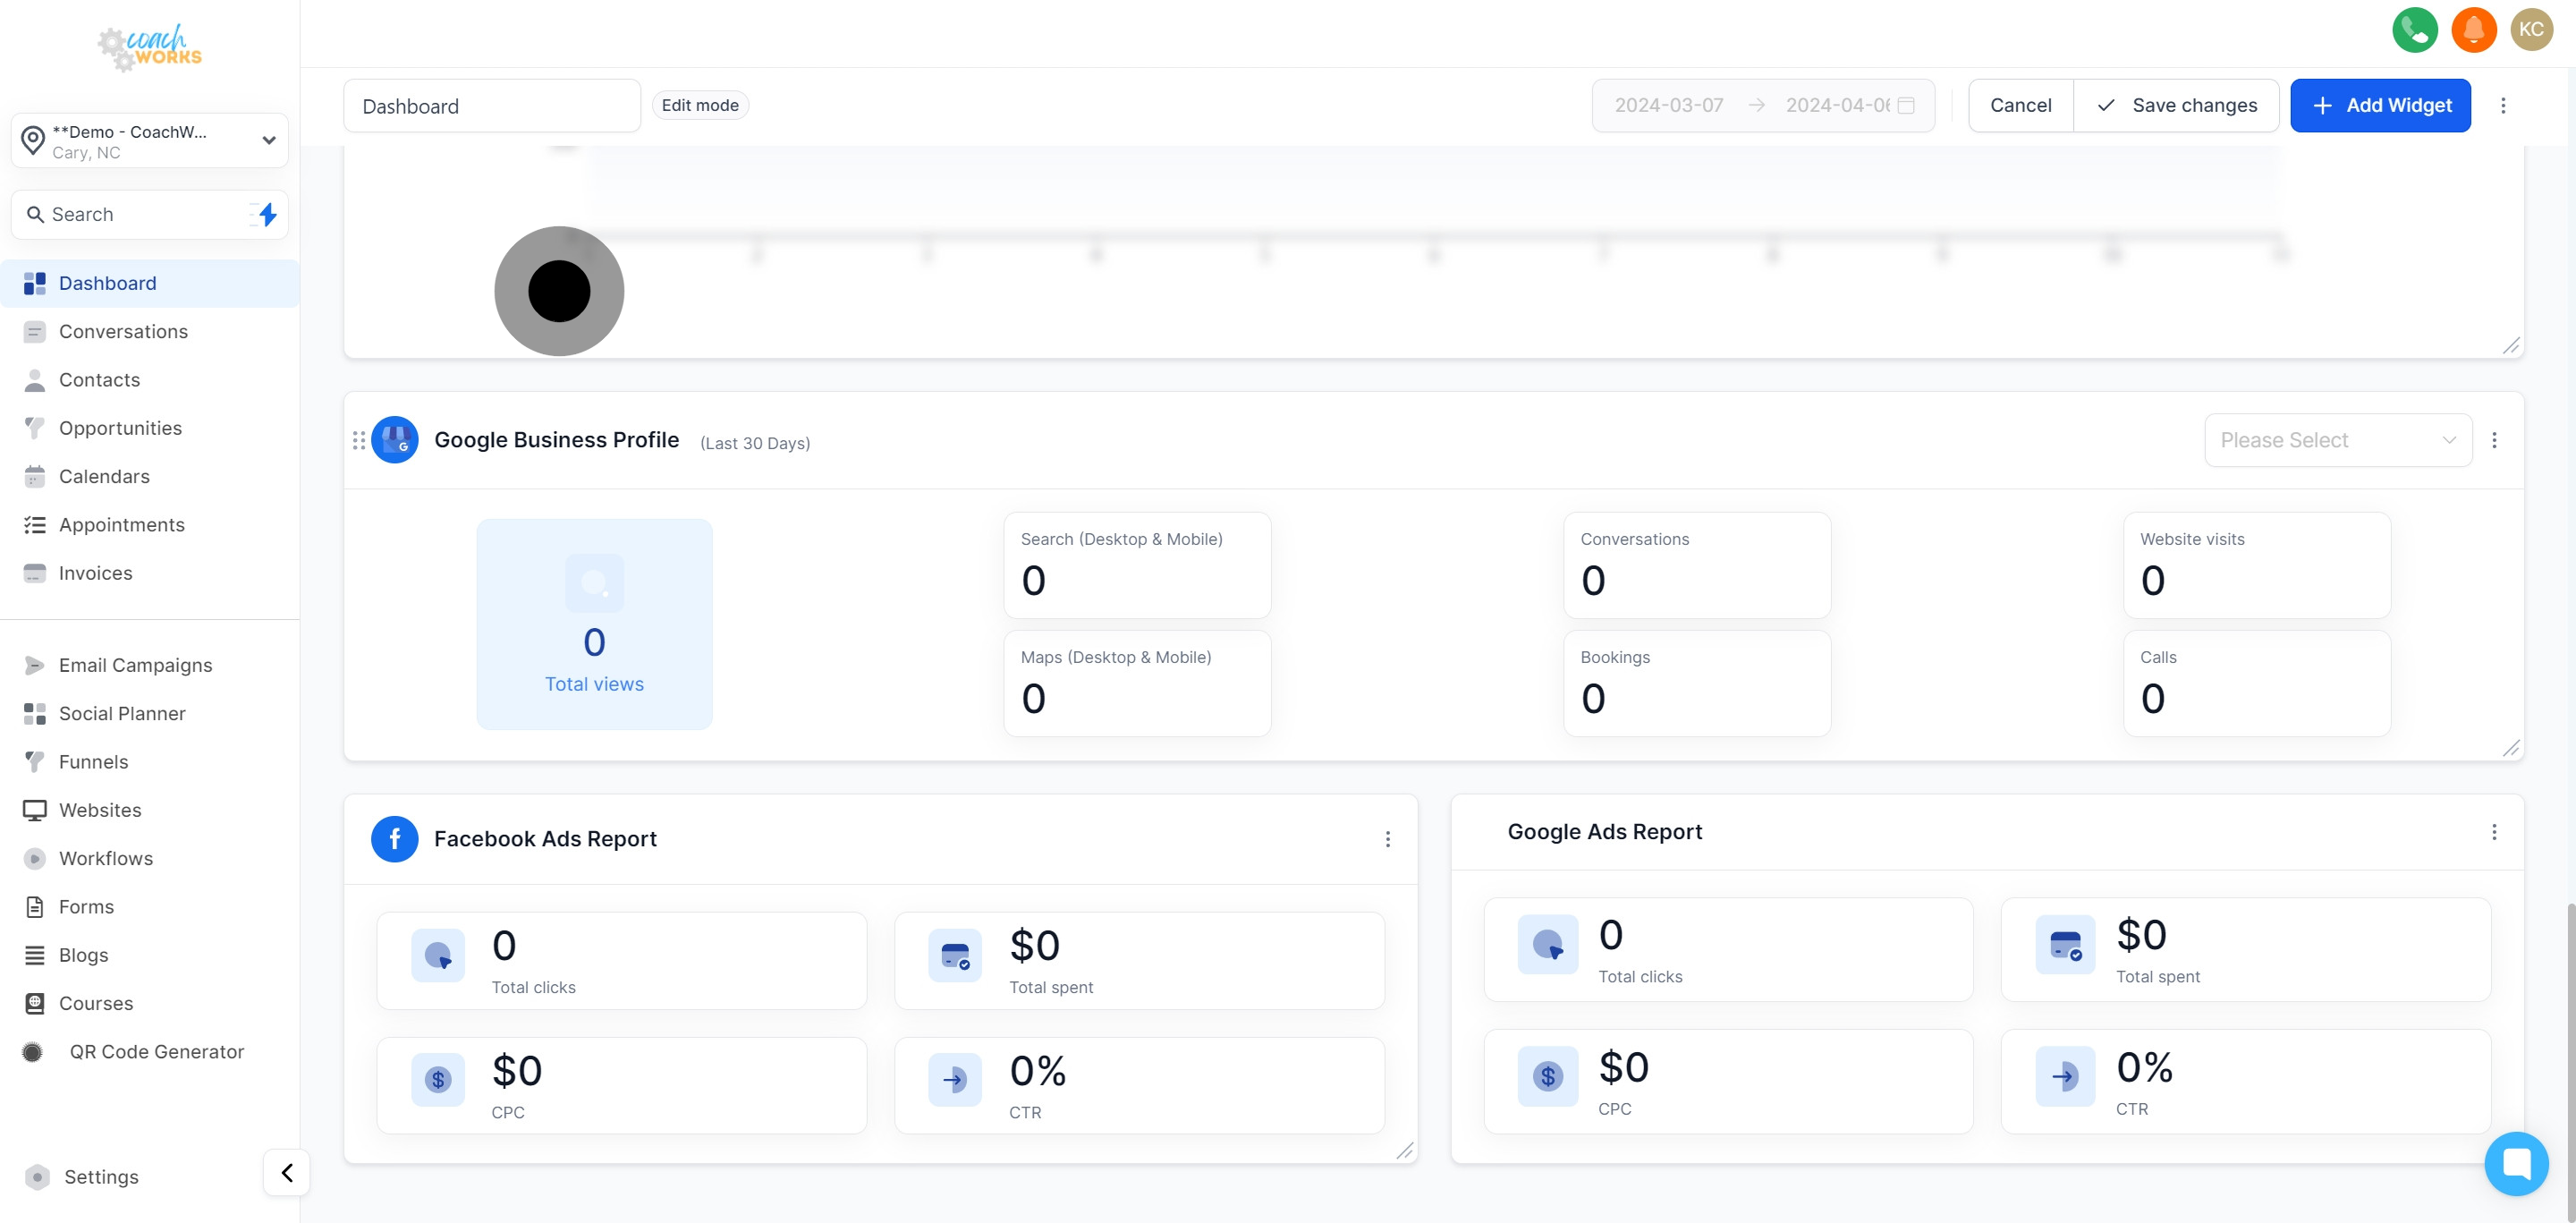
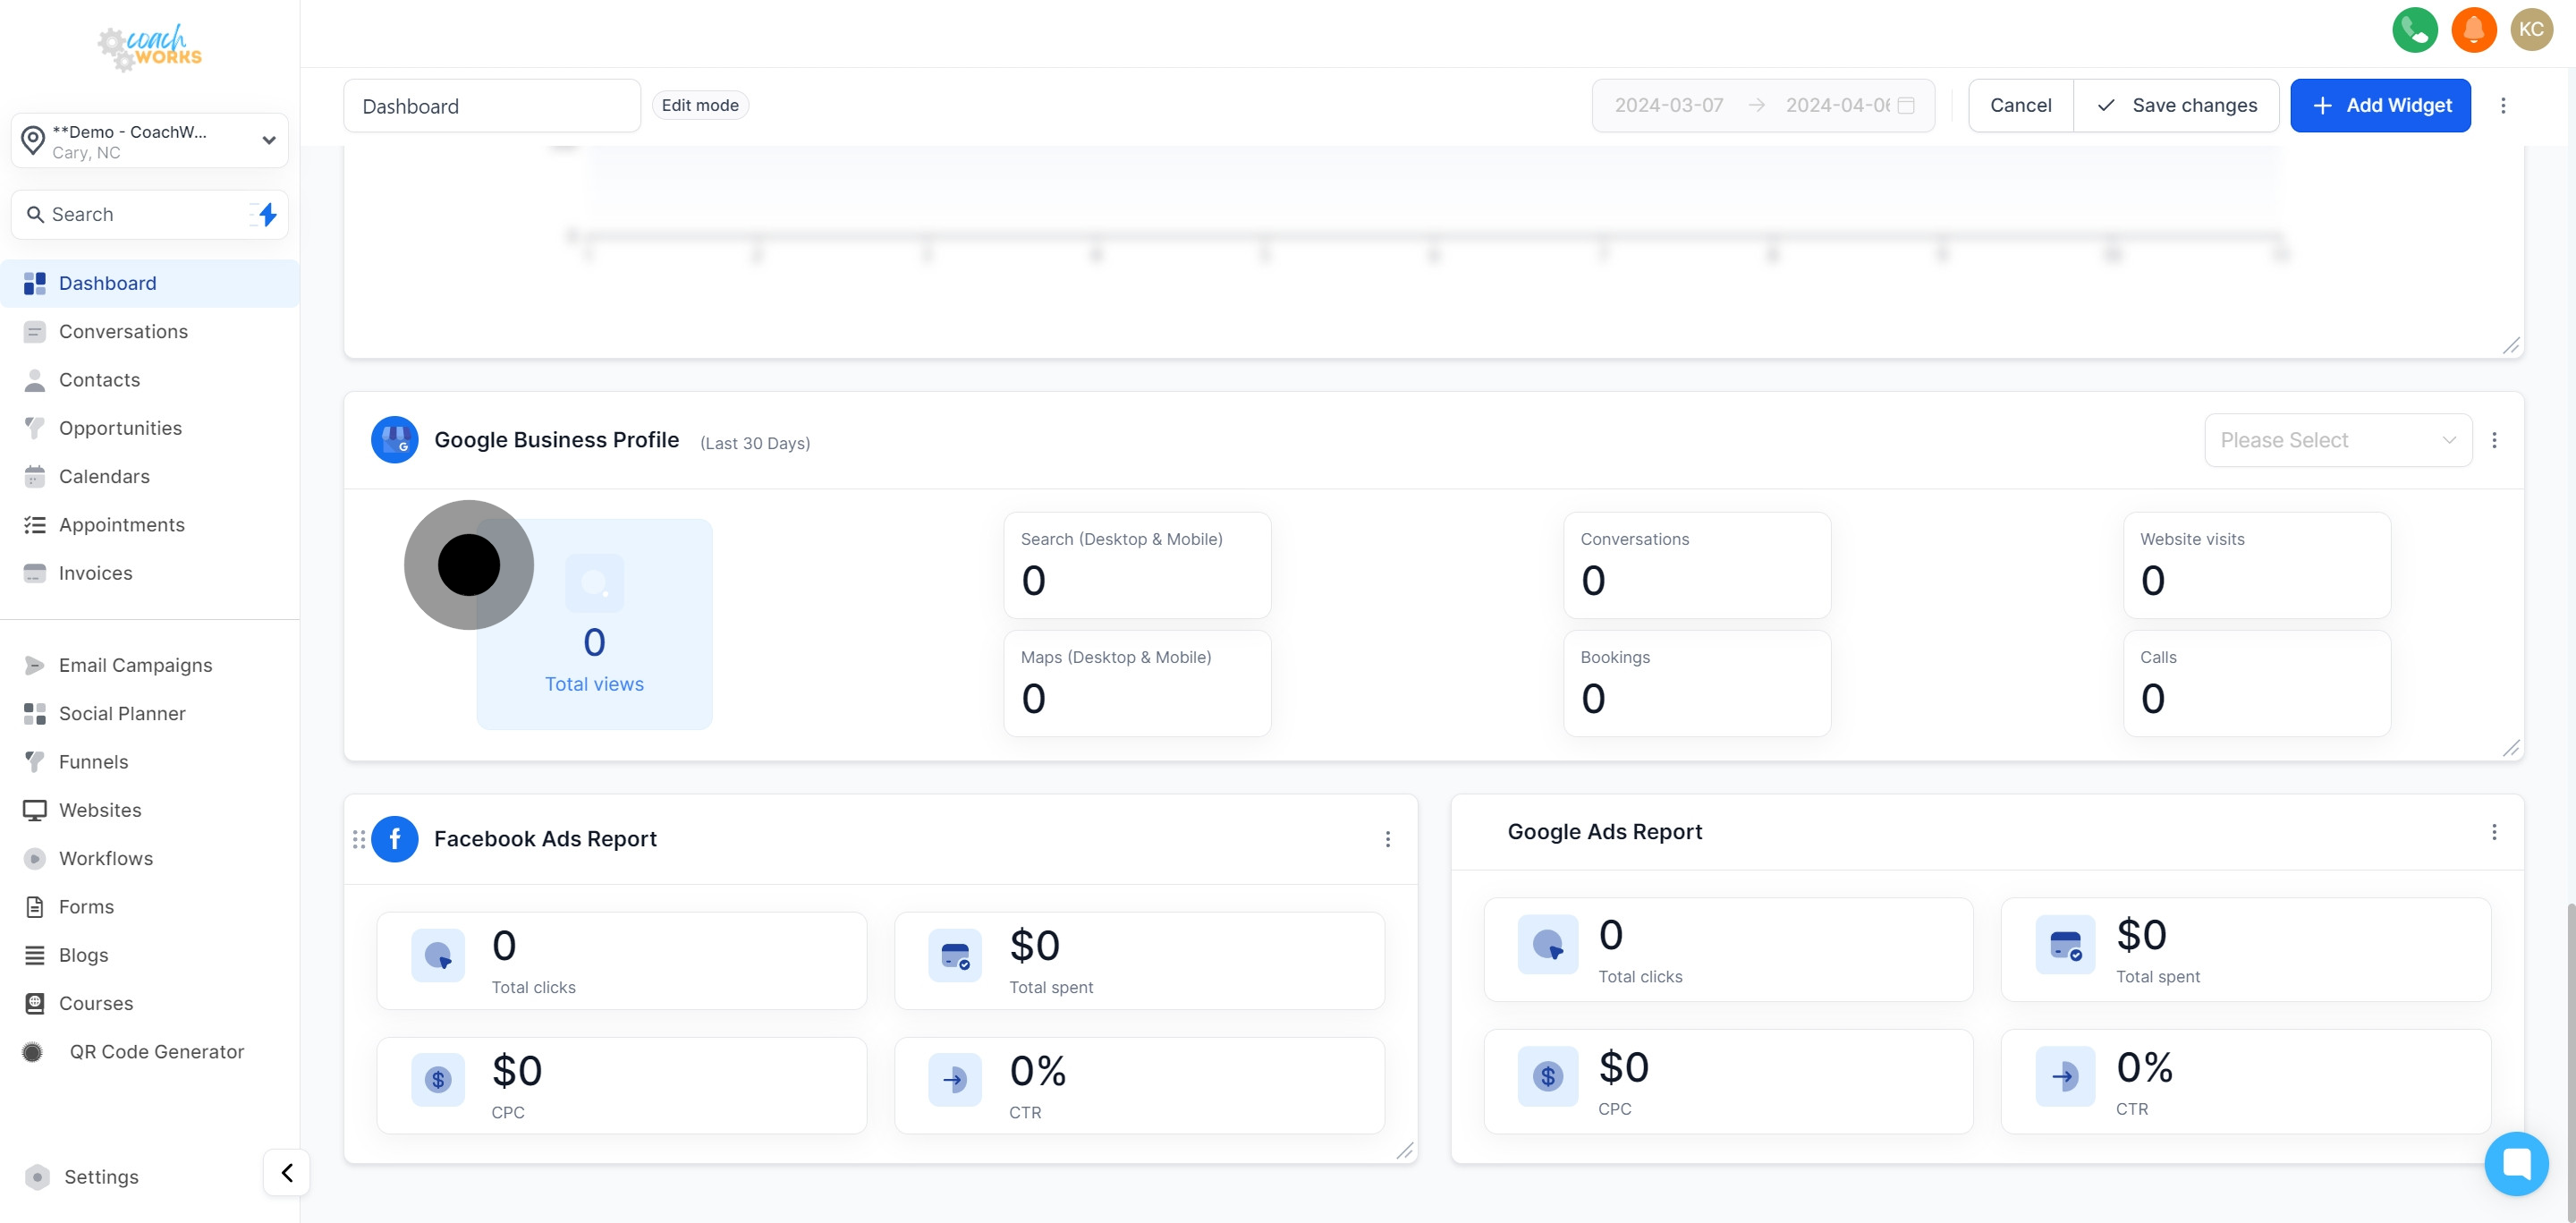
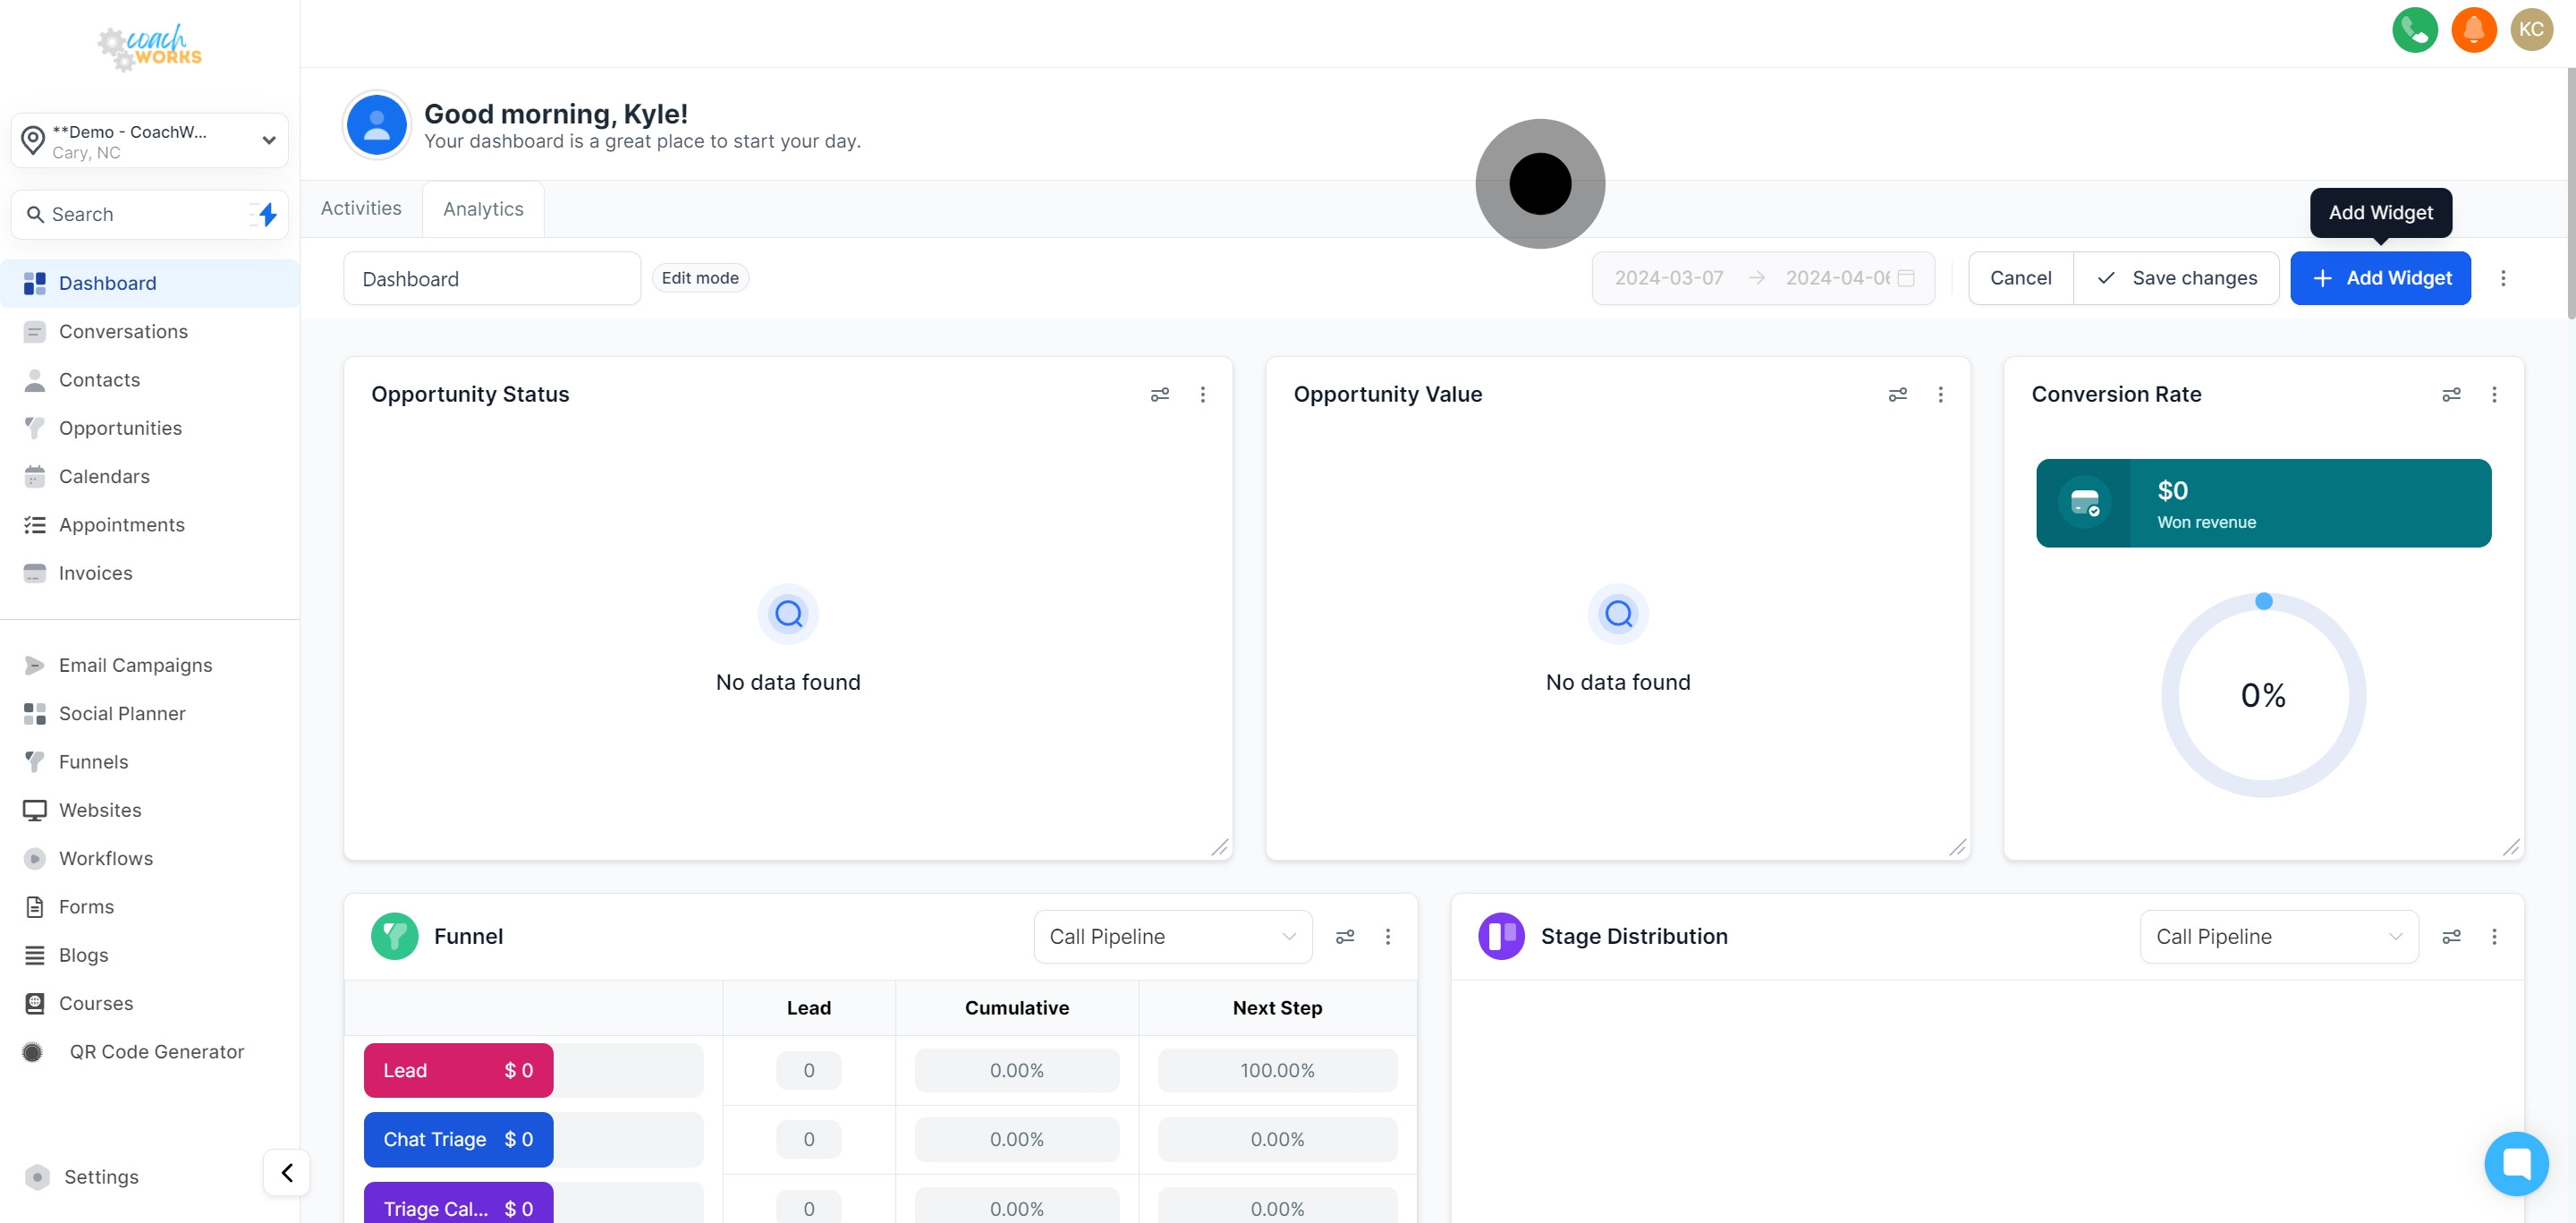
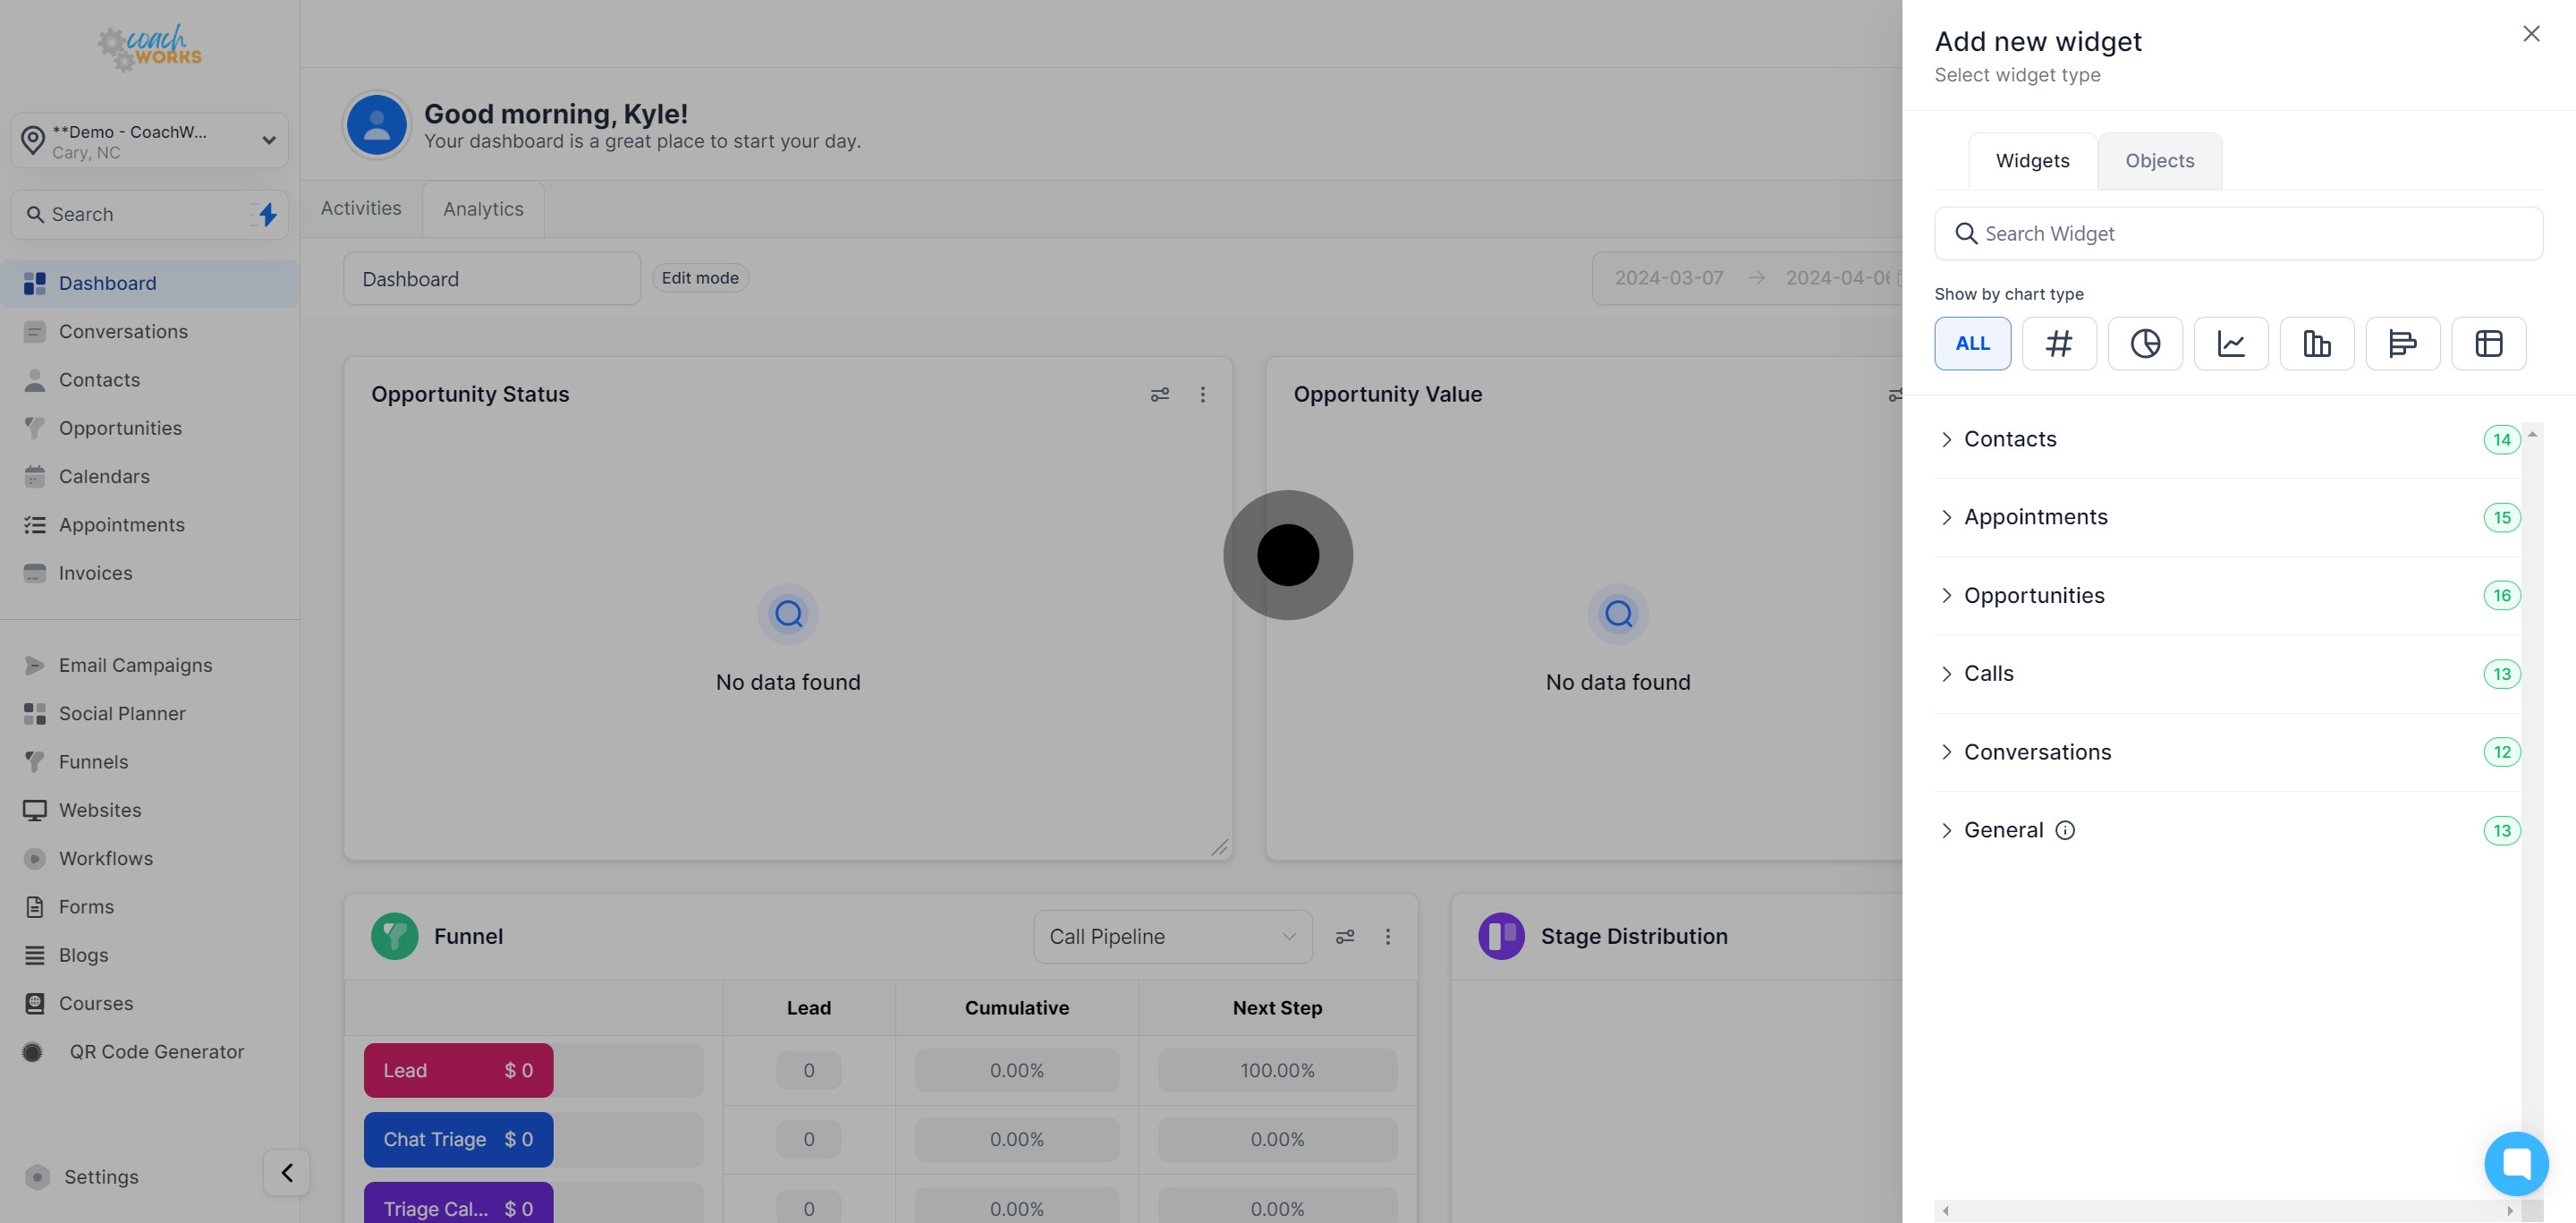
Add a personalized widget by clicking on "Add Widget" to enhance your dashboard with custom analytics views.
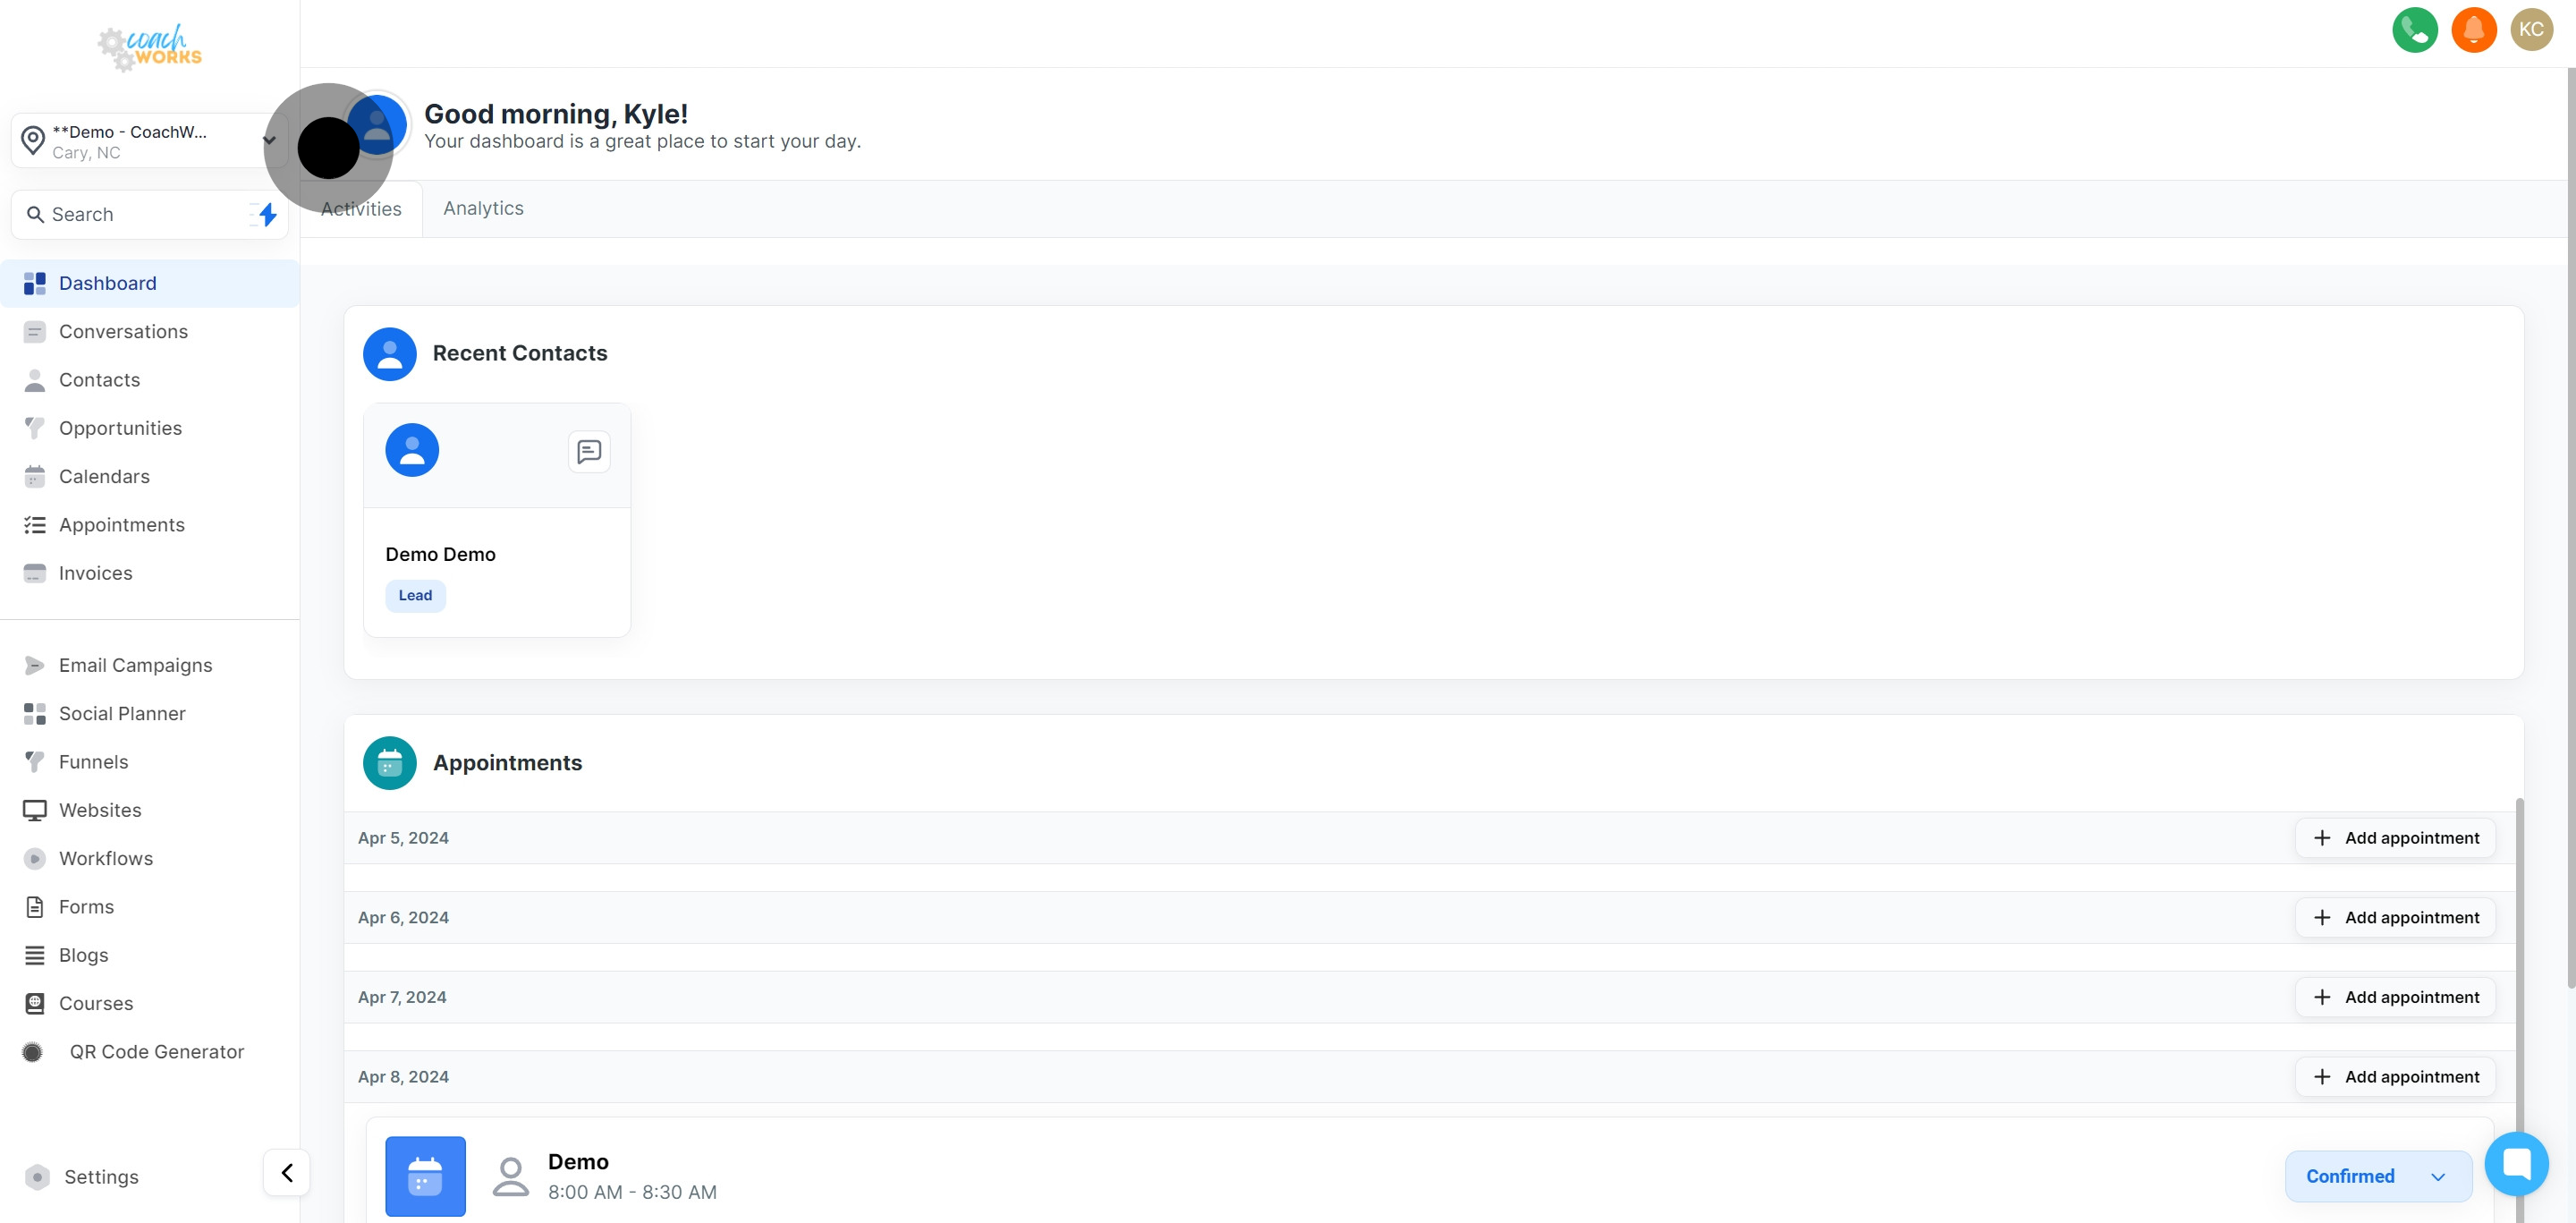
From contacts to appointments, opportunities, calls, and conversion widgets, expand each section to visualize different aspects of your business operations.
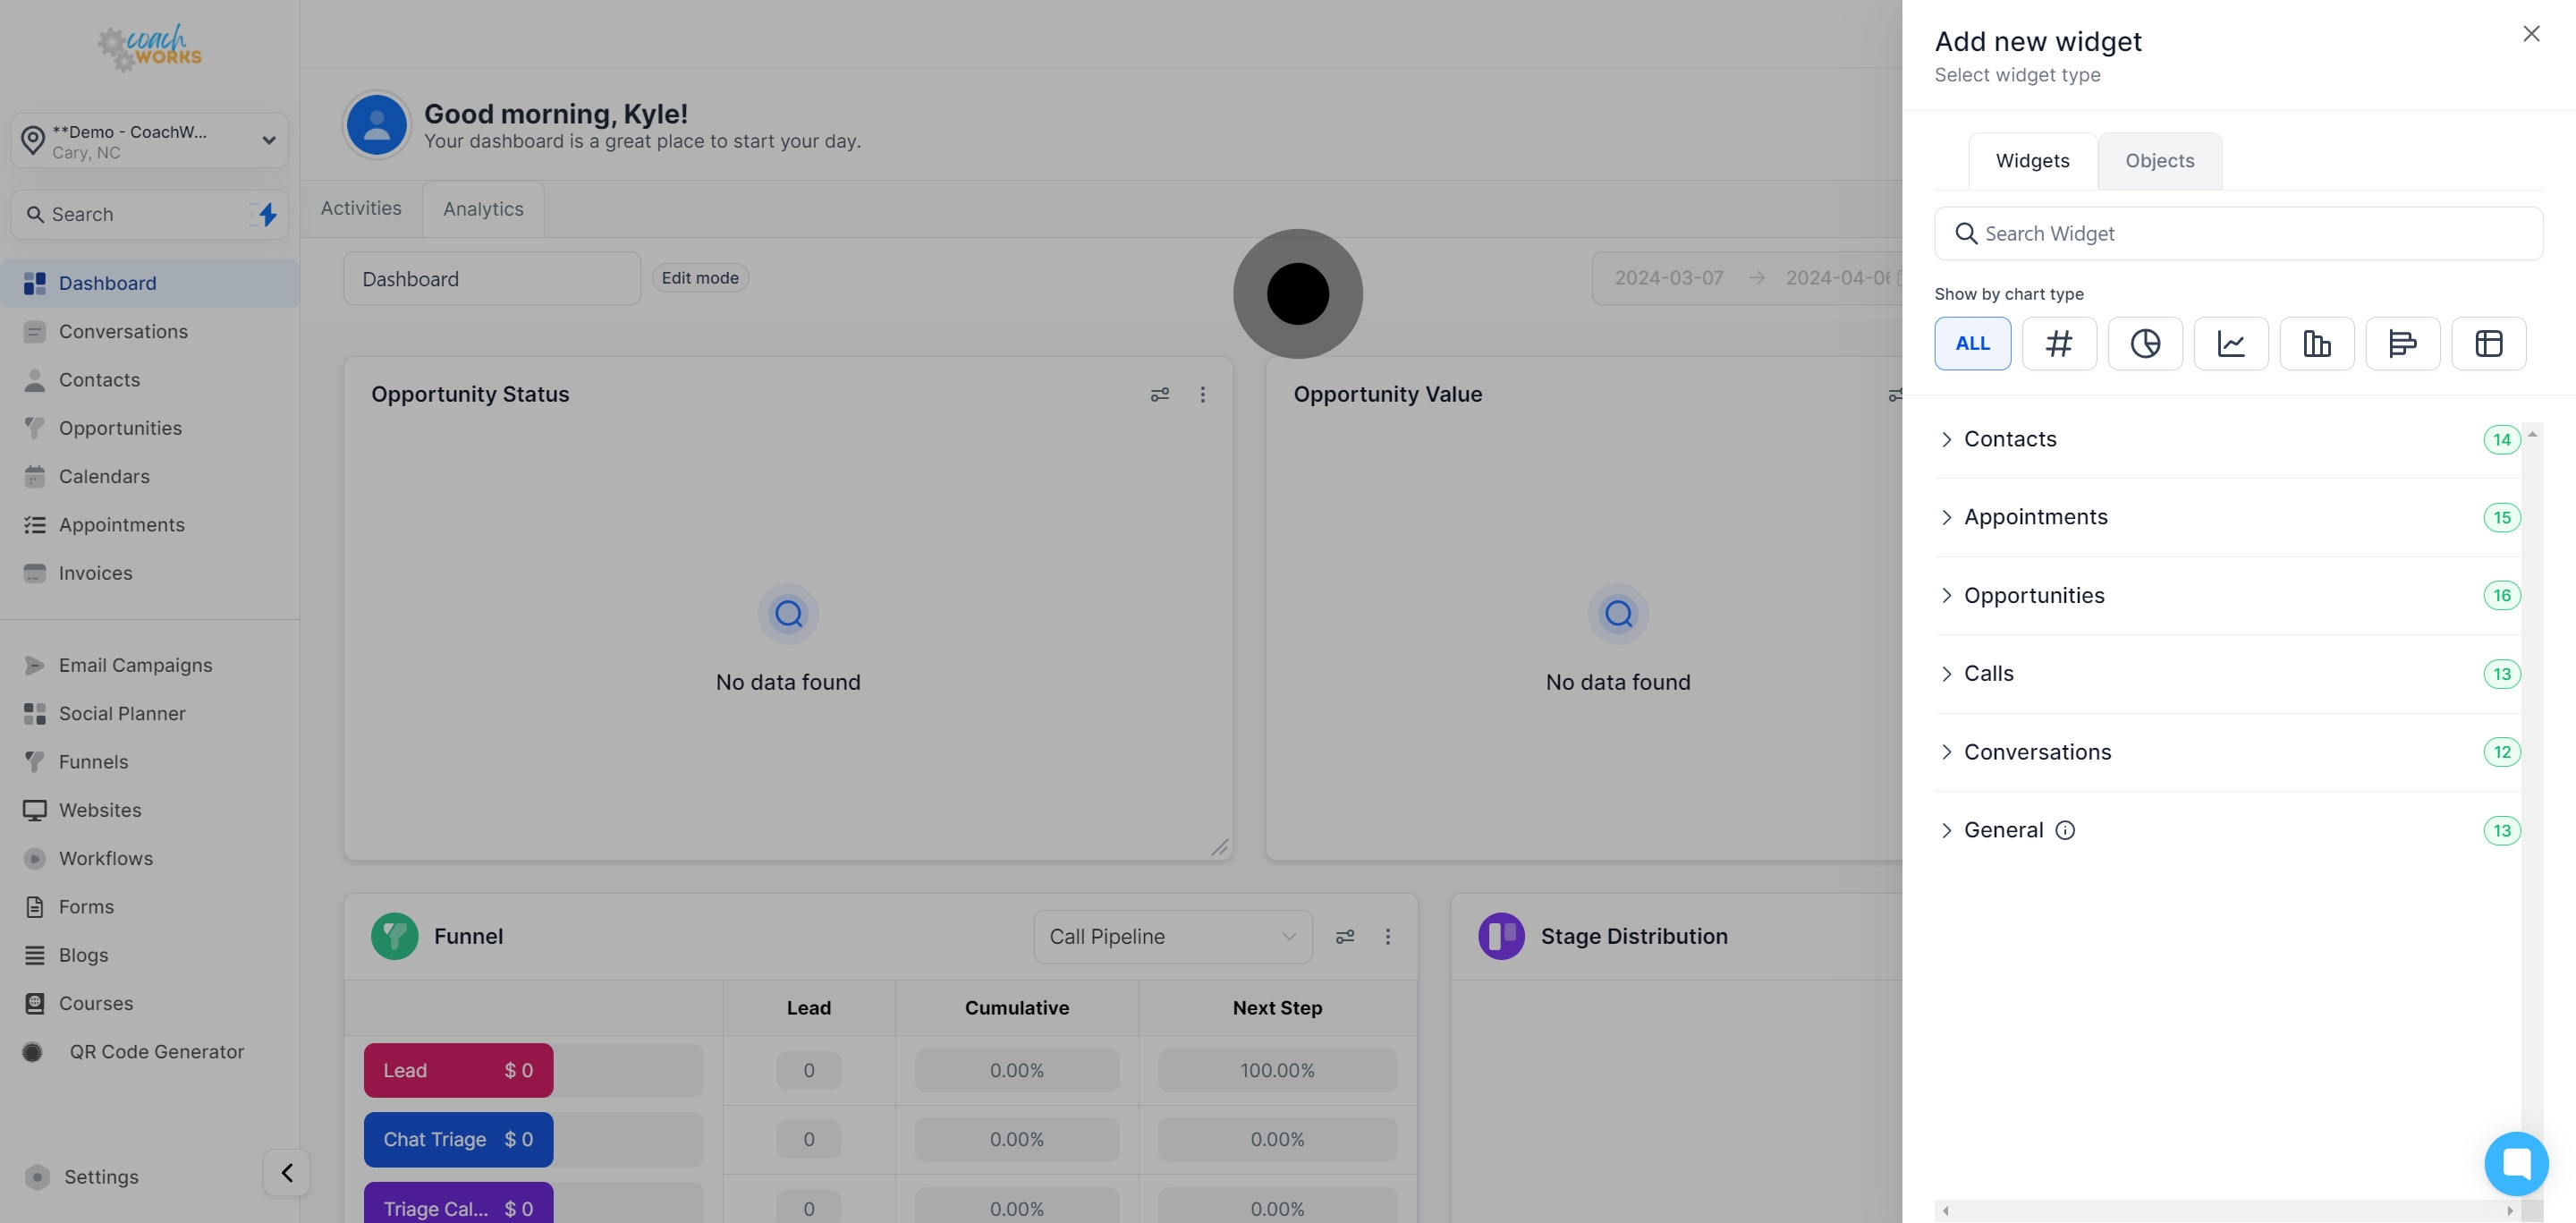
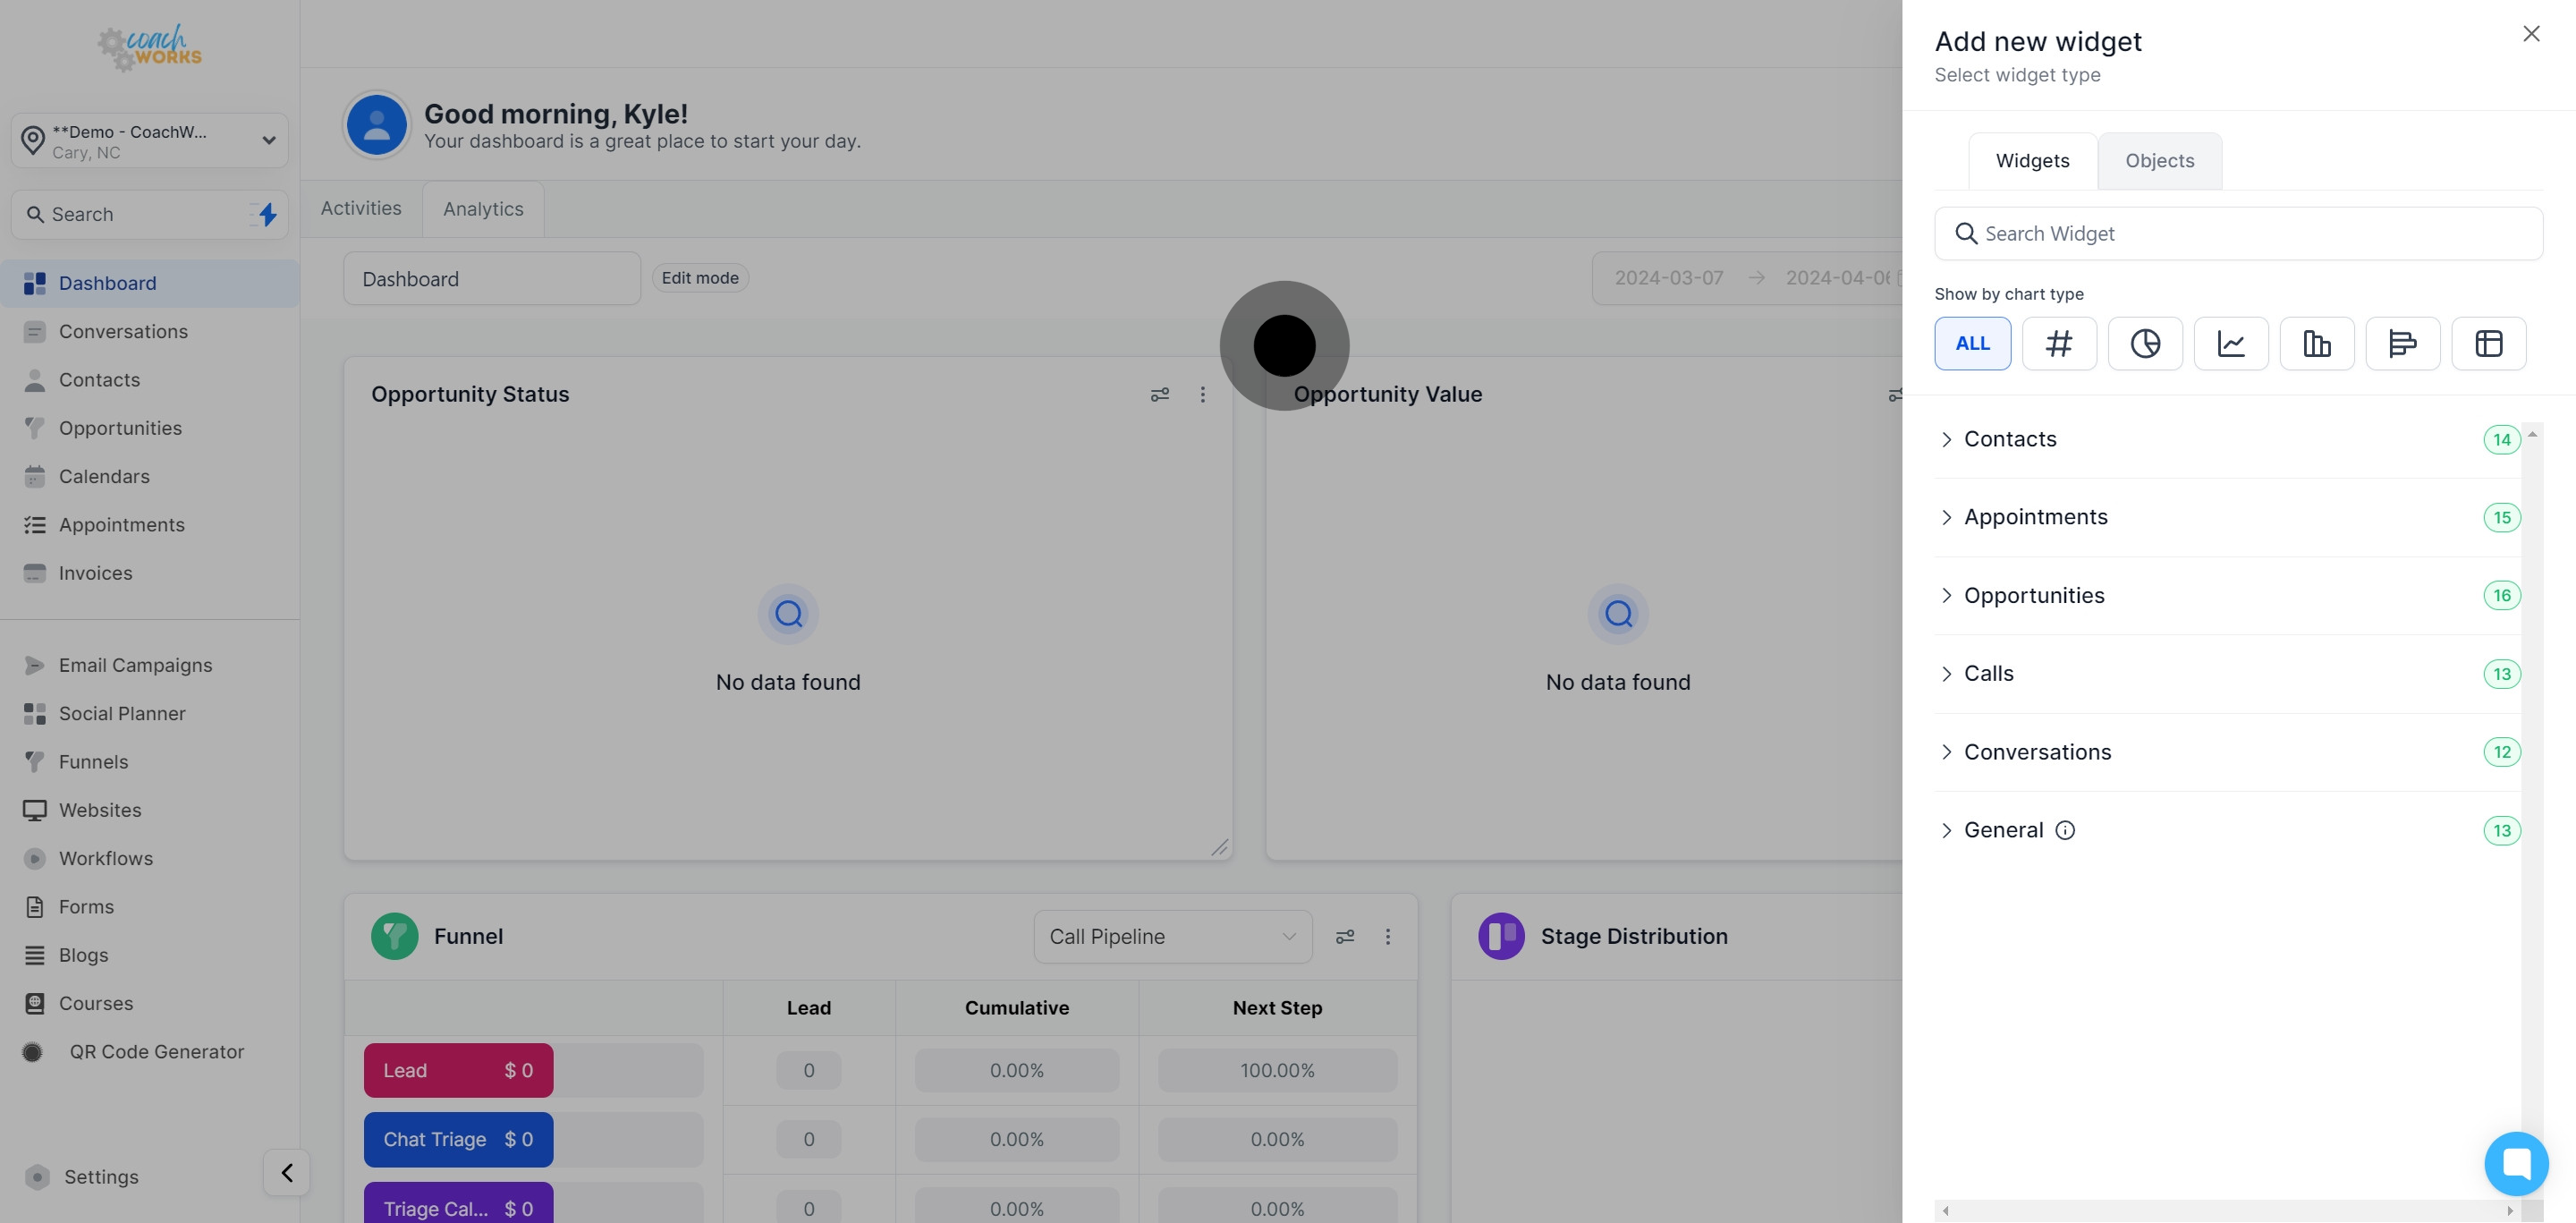
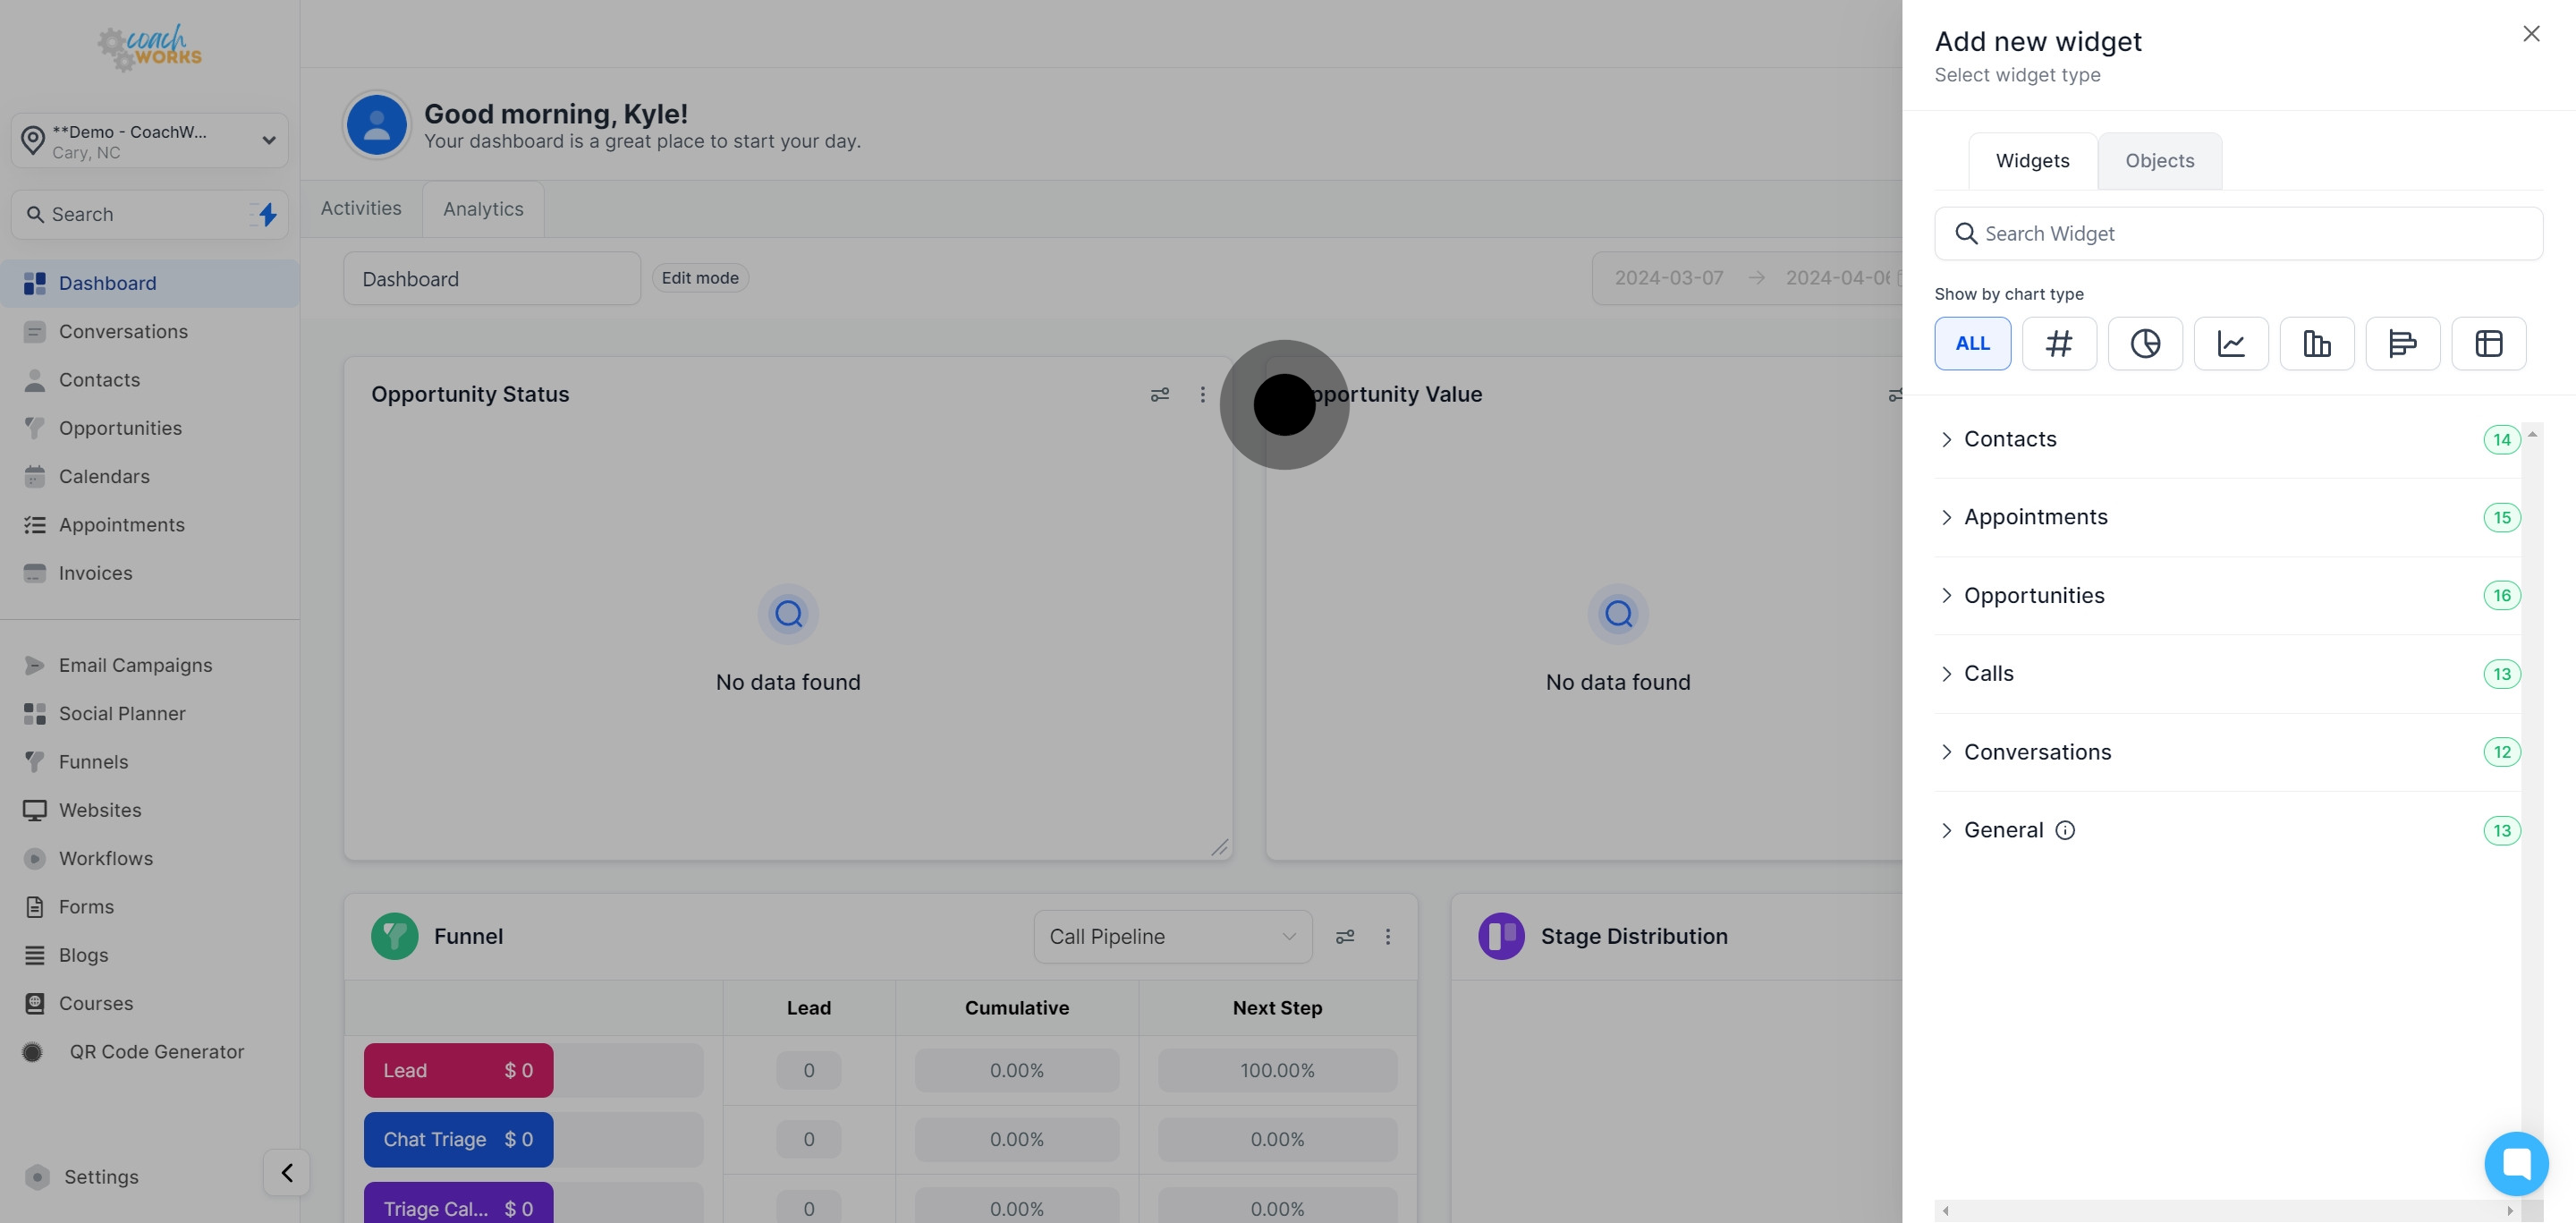
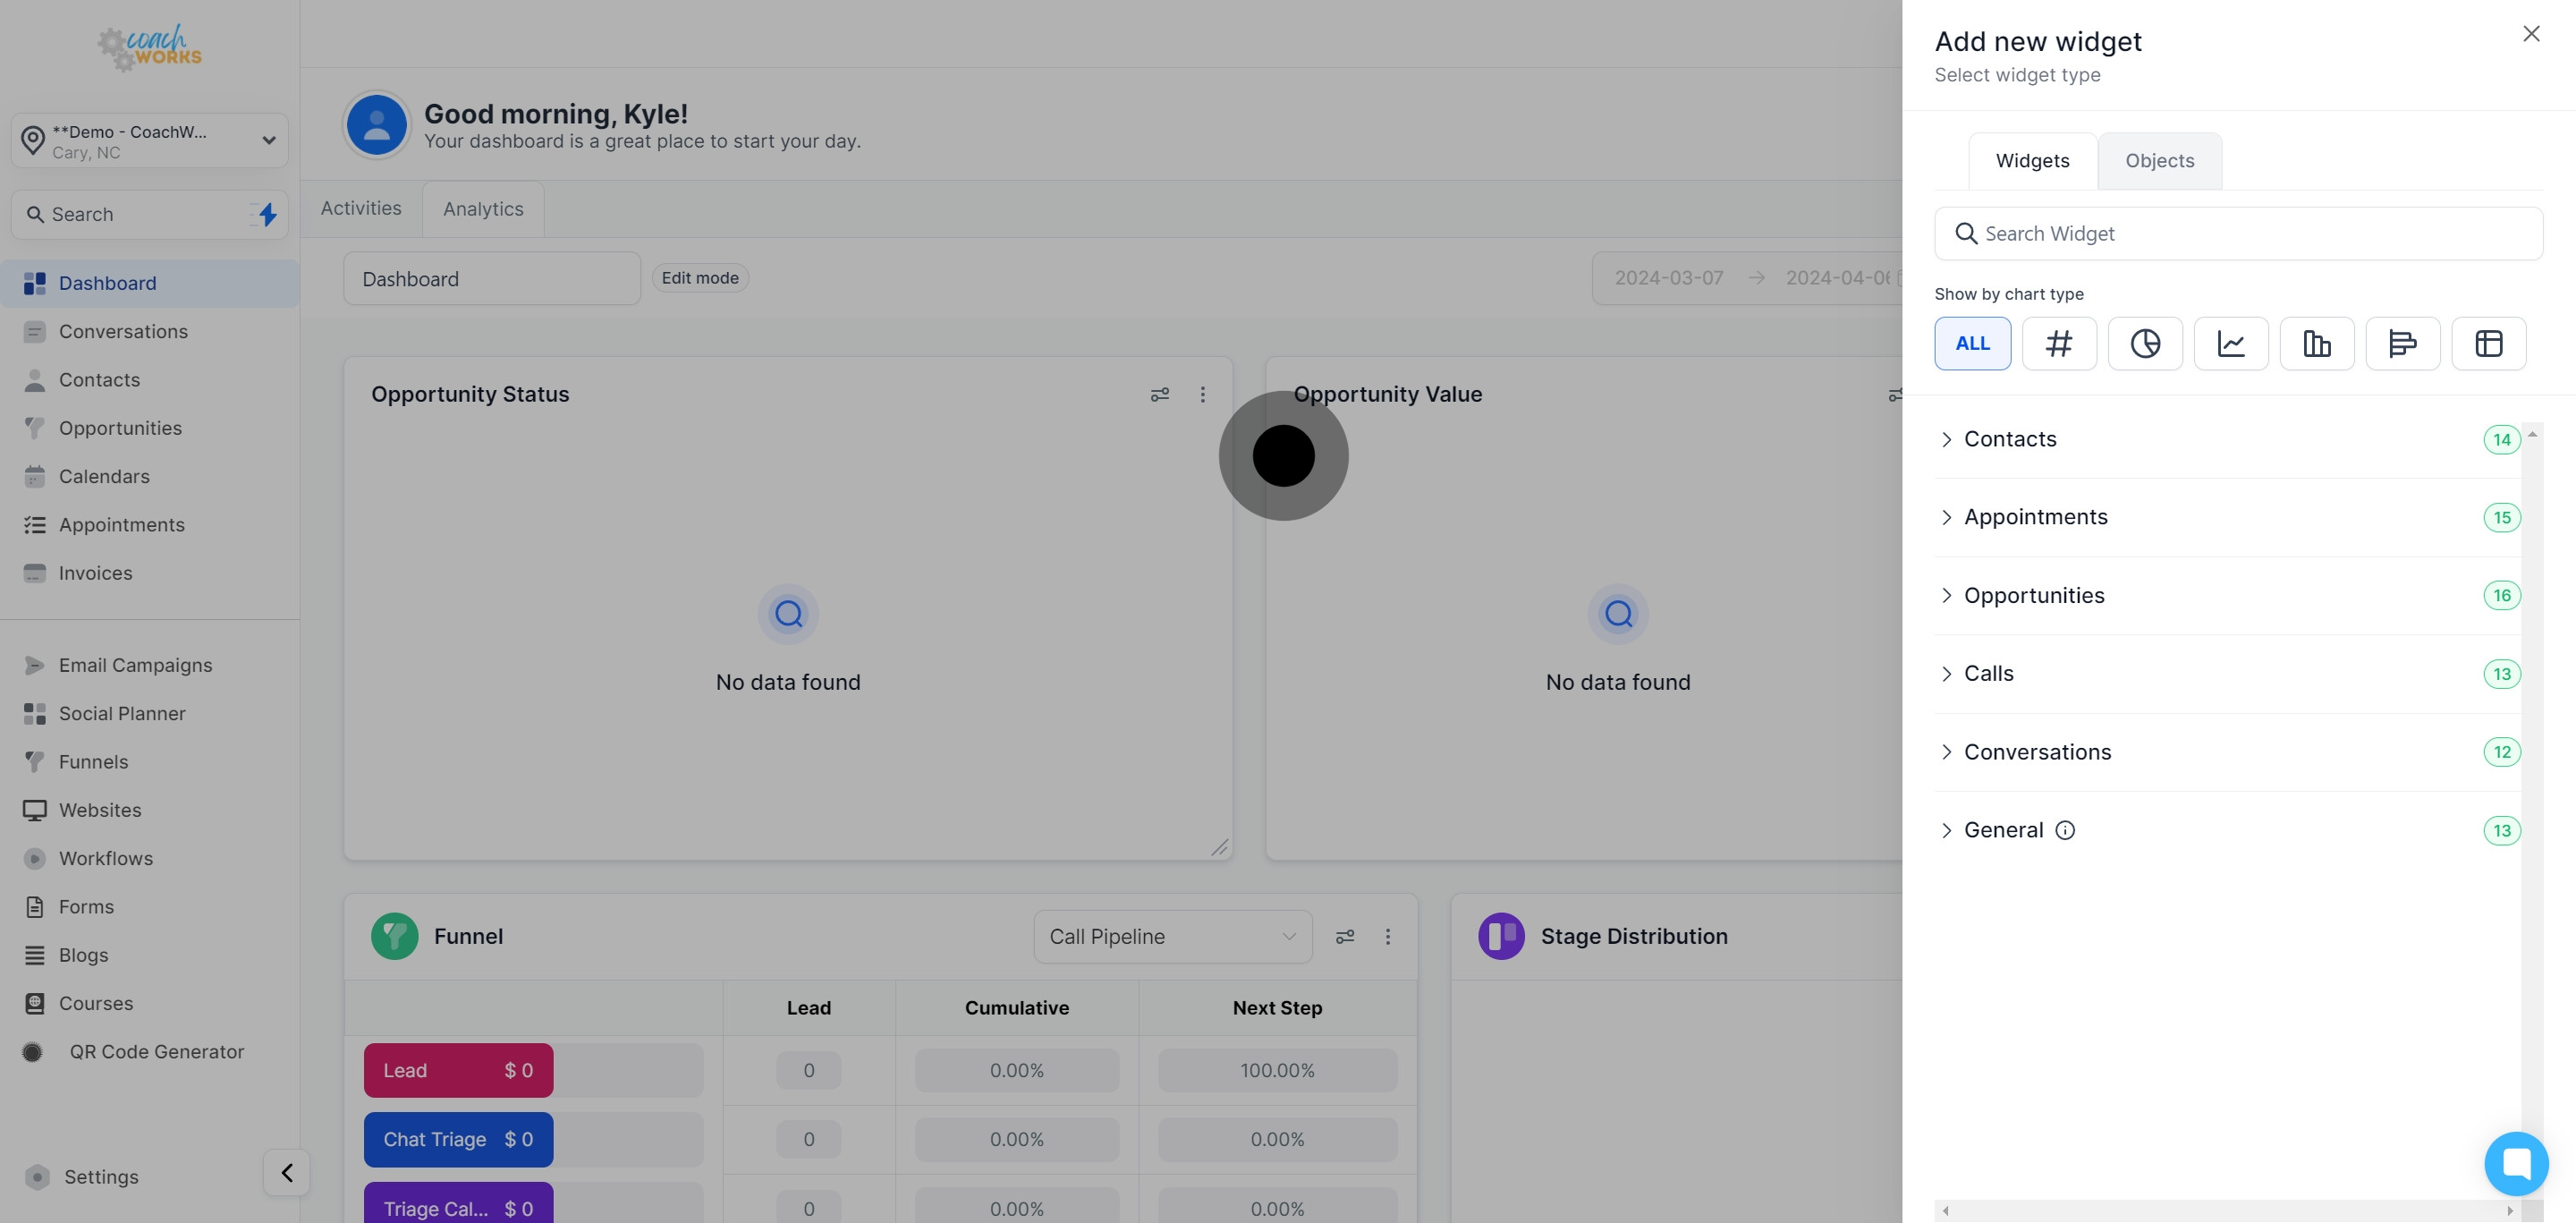
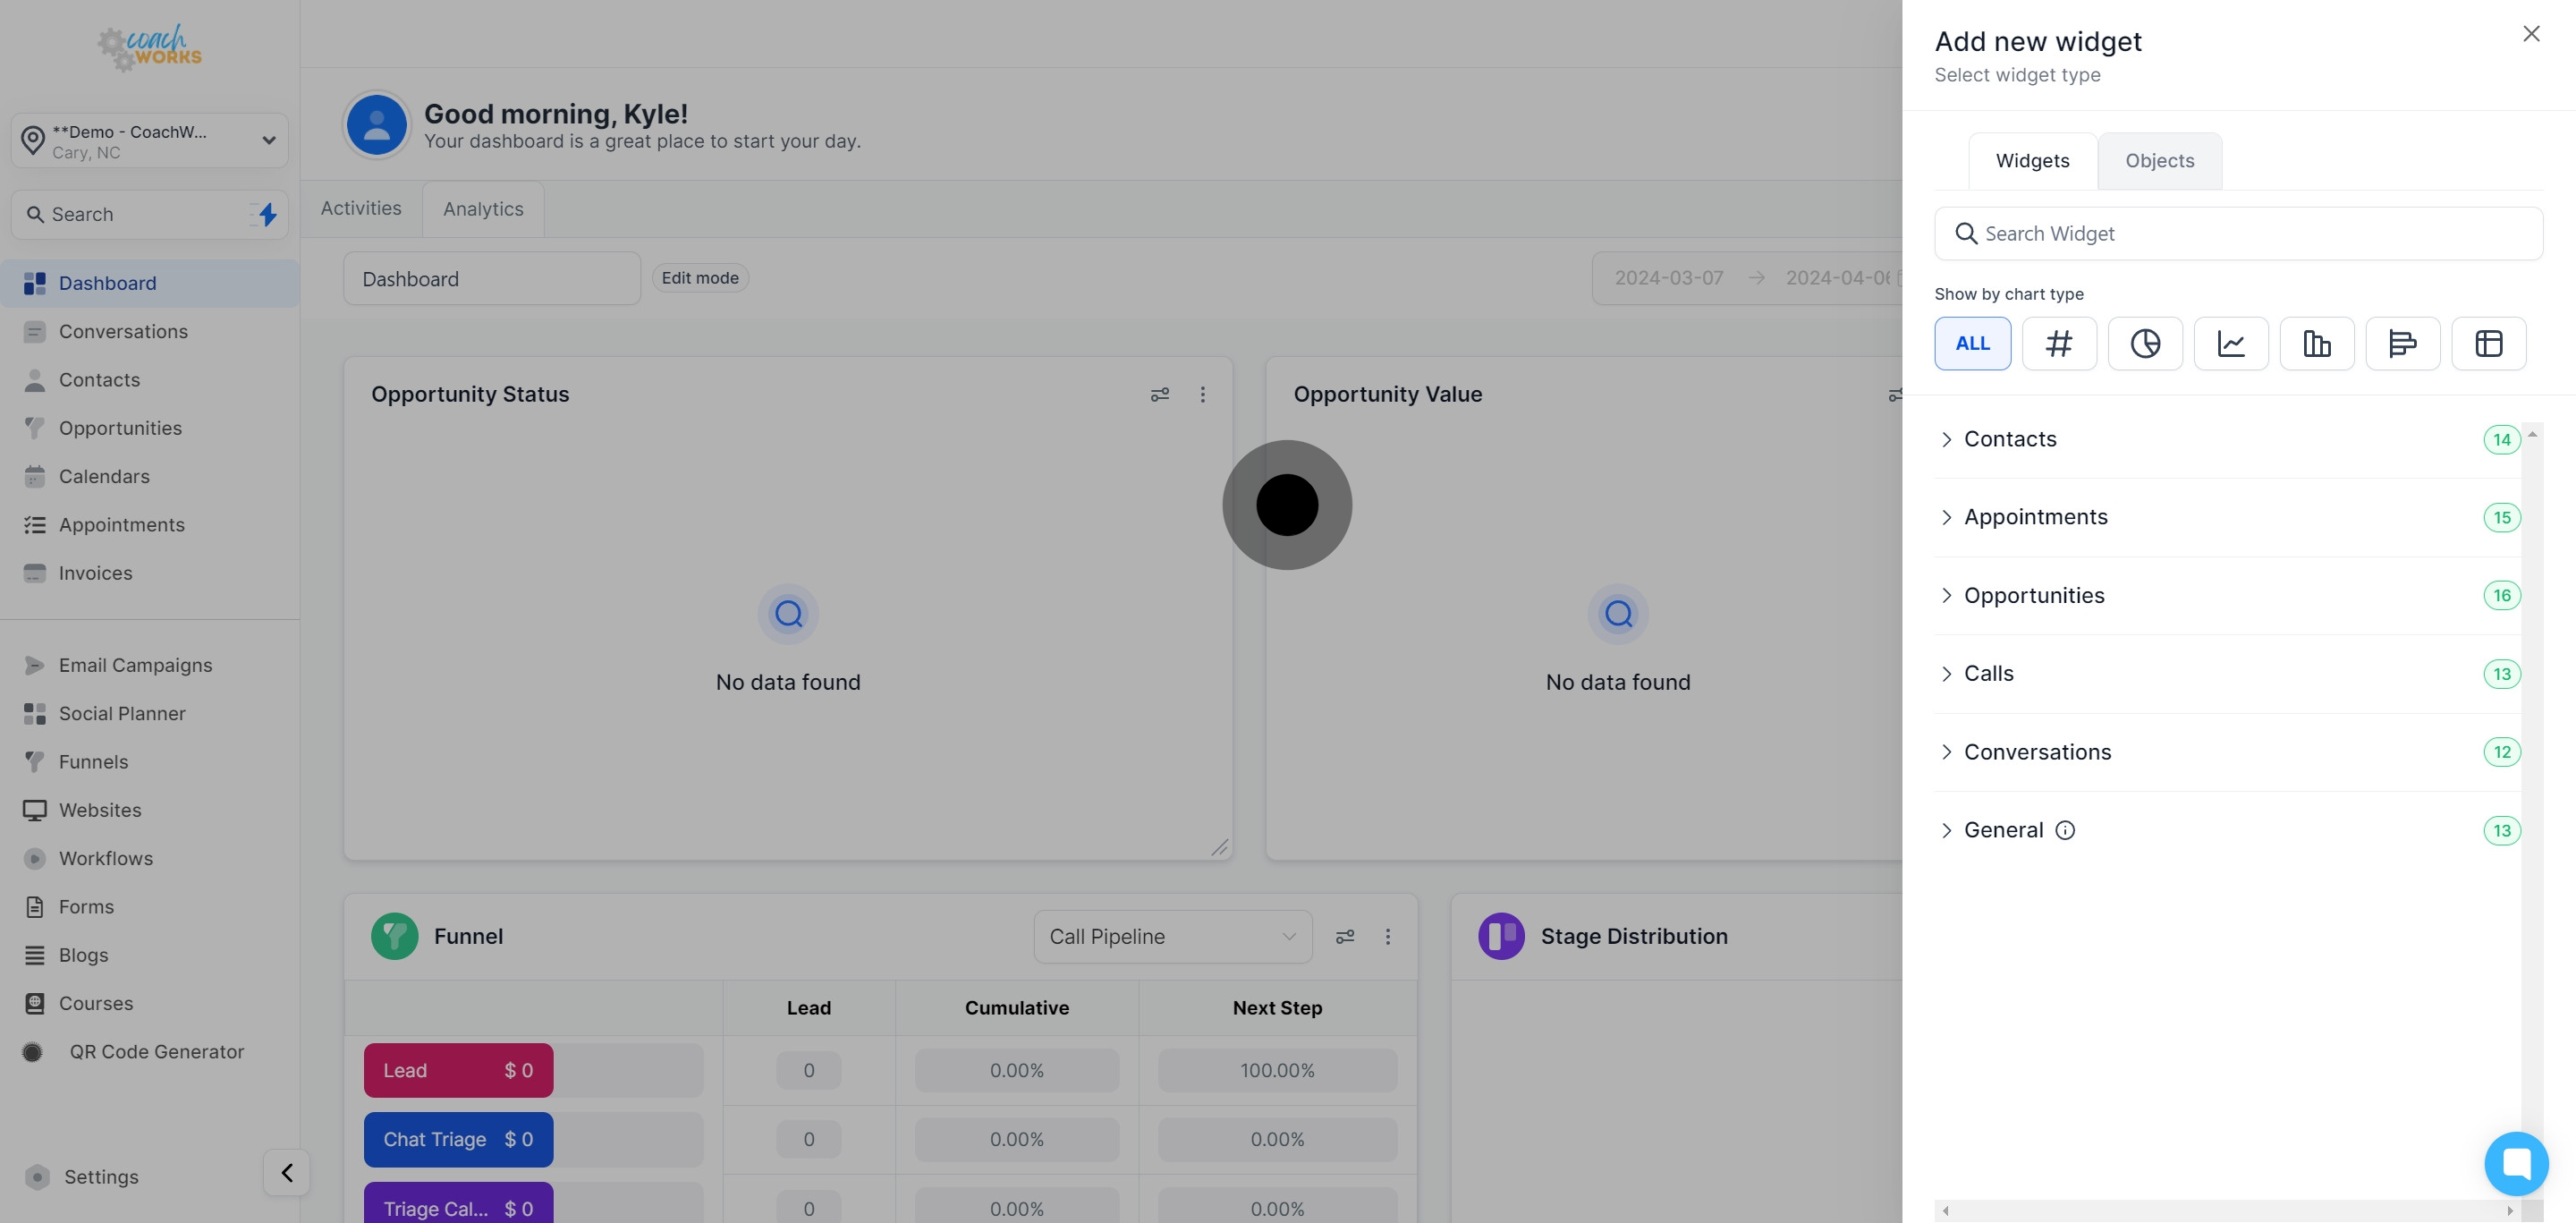
Don’t forget to explore the generally used widgets for a quick overview of essential data points.
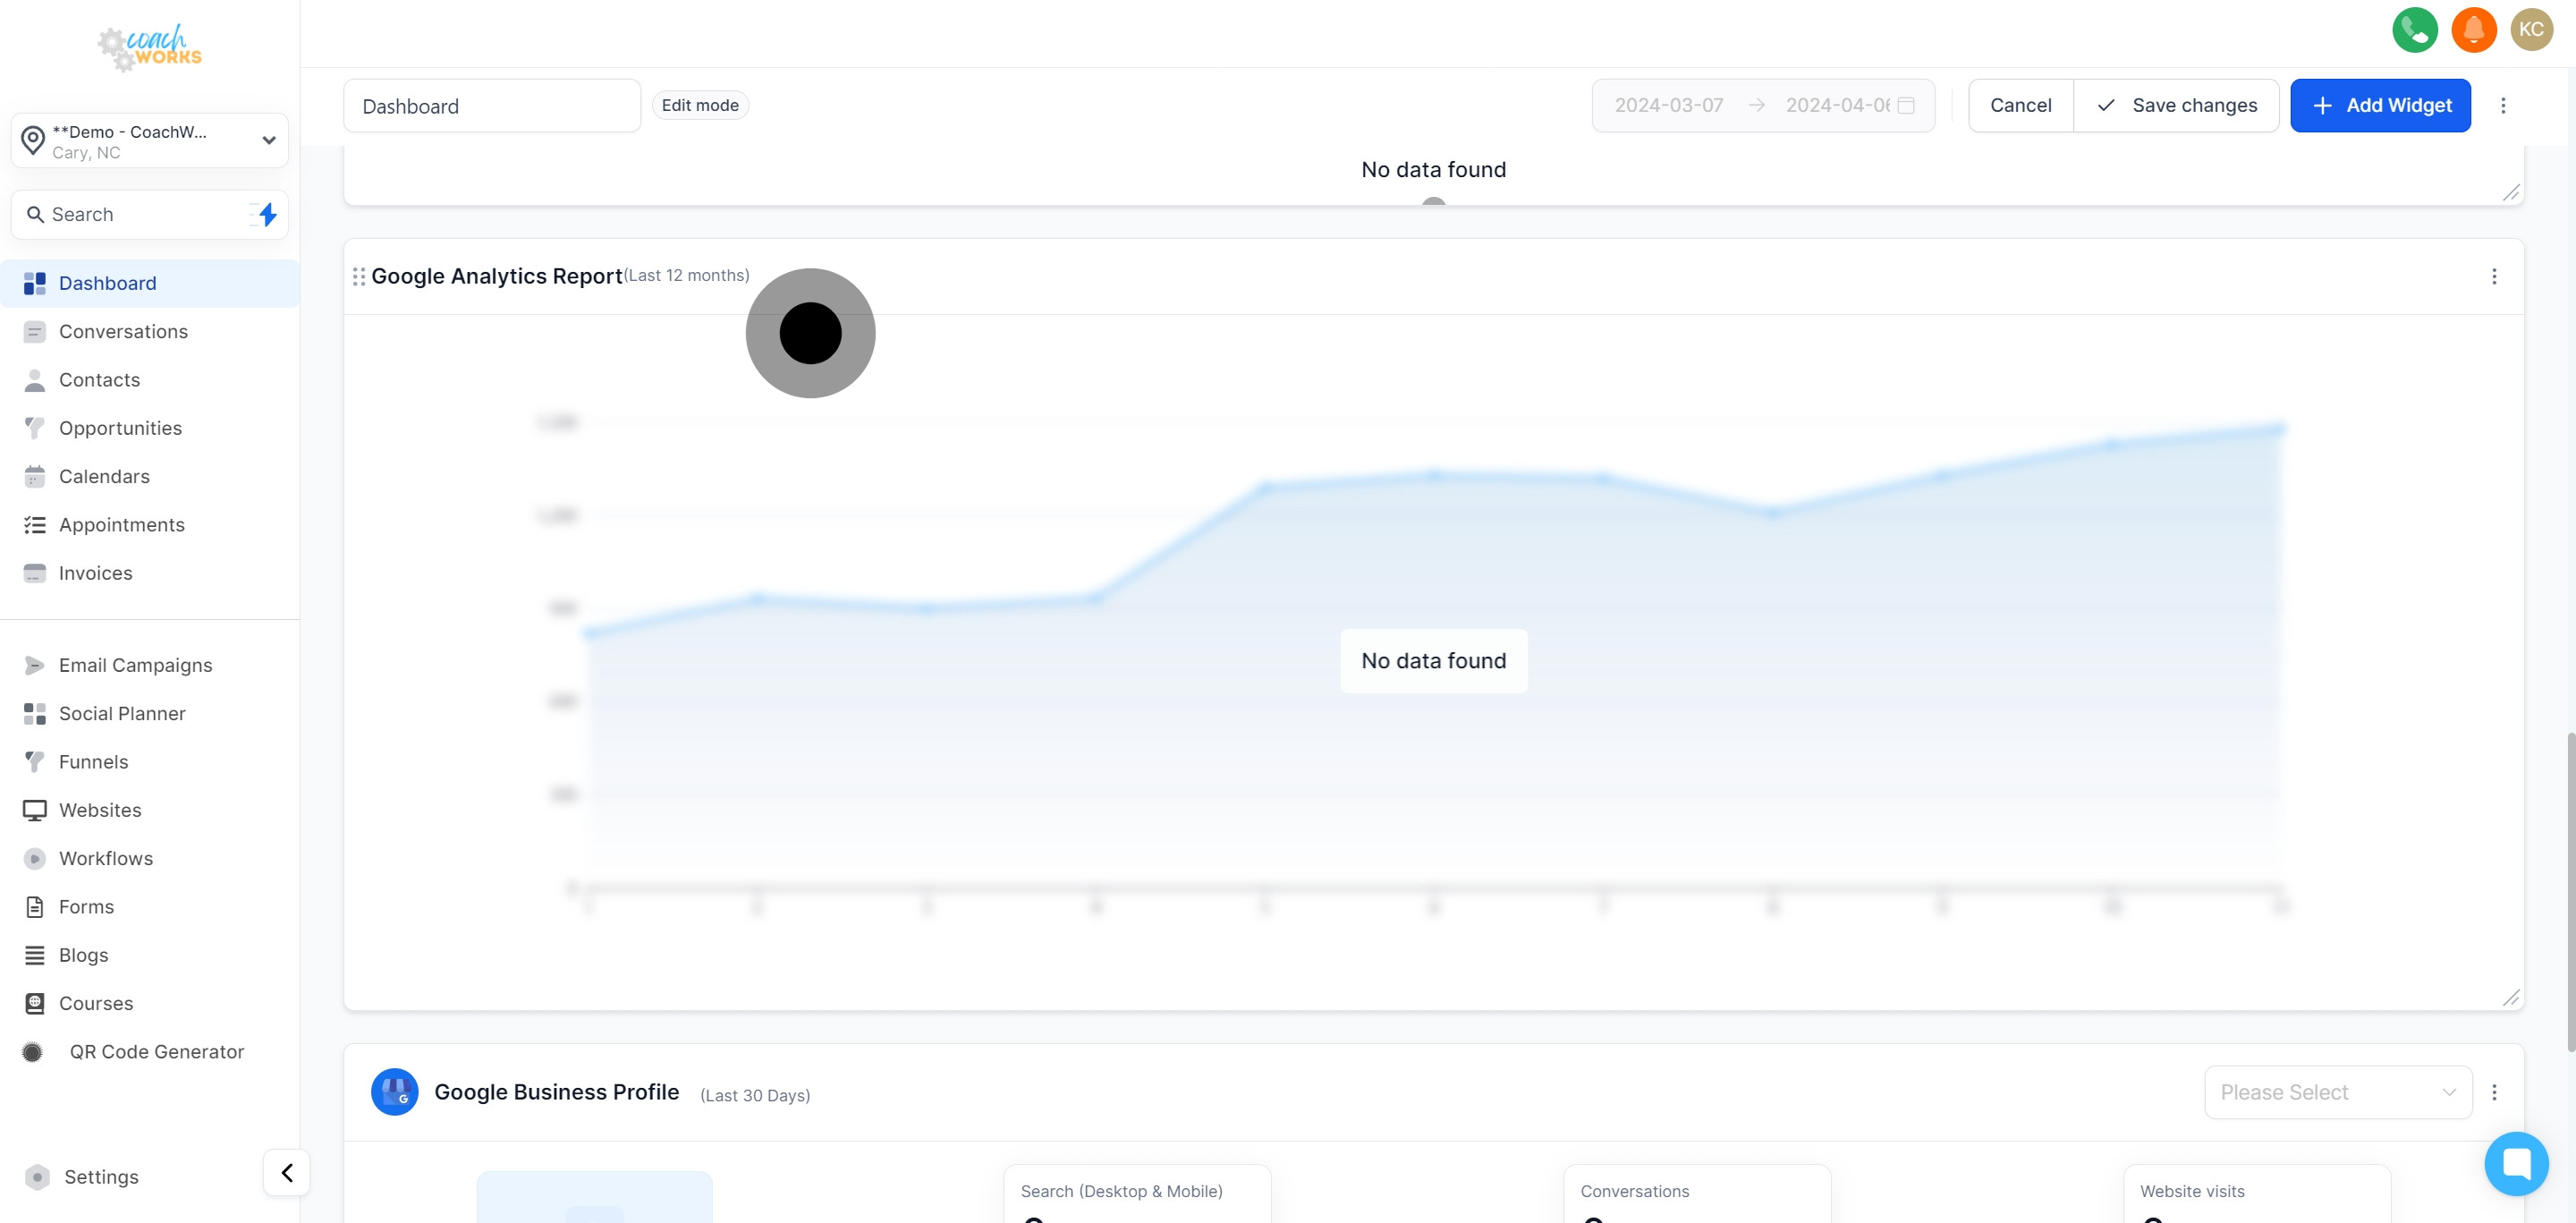
After customizing your dashboard with widgets, ensure to save your changes by clicking on "Save changes".
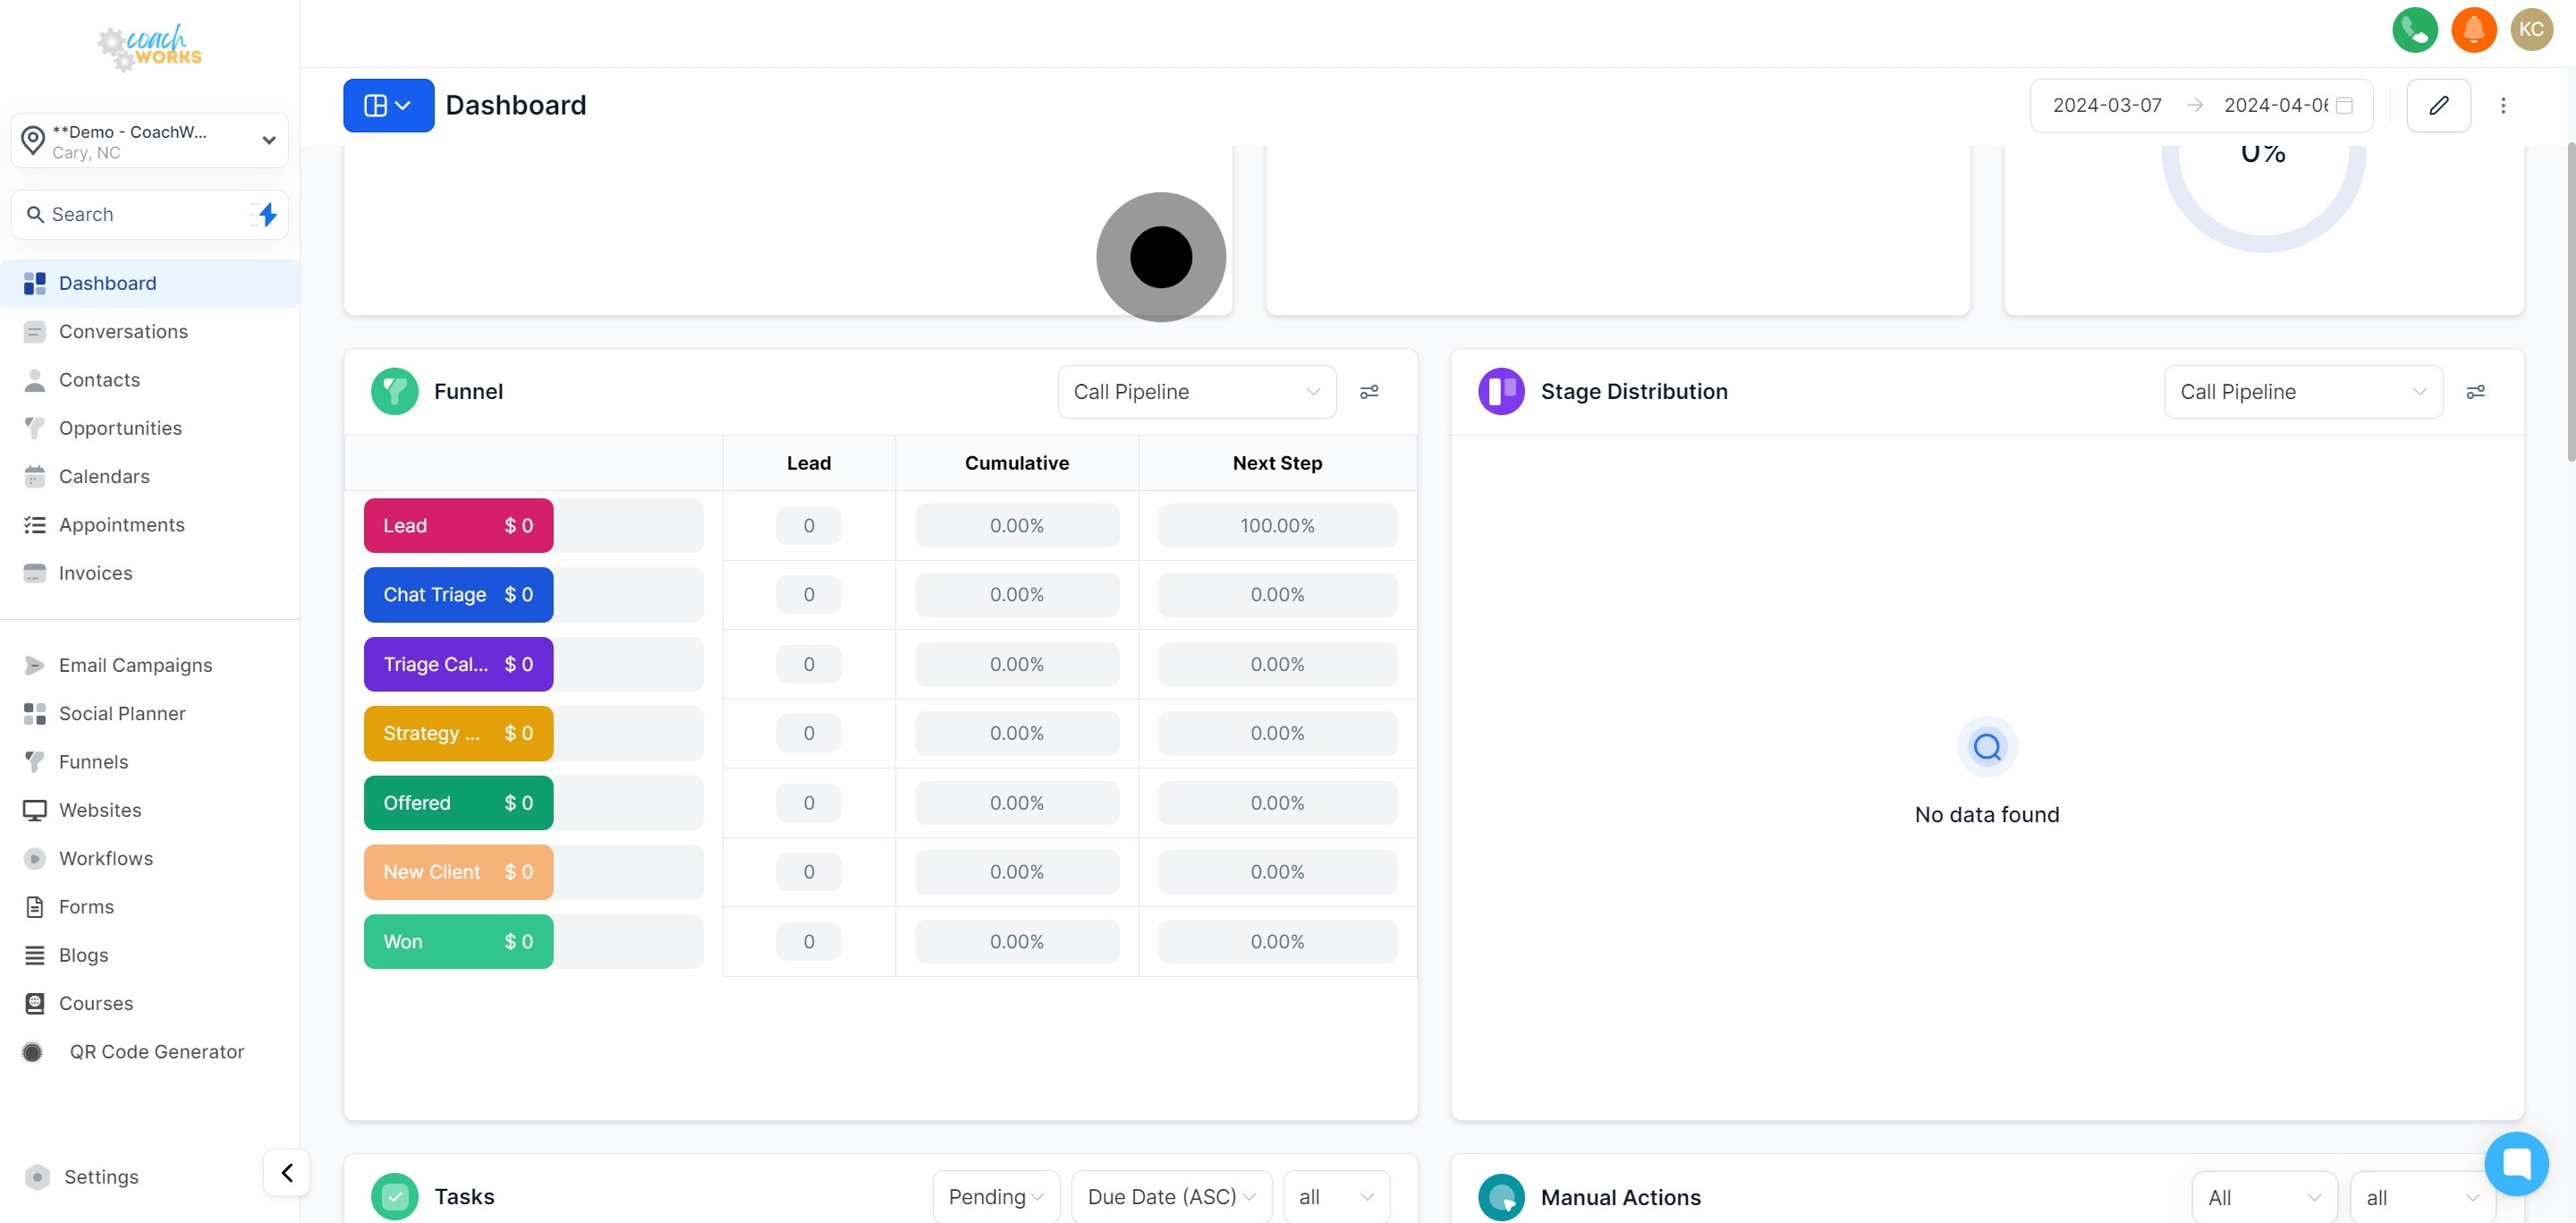
View your marketing funnel data under the "Funnel" window.
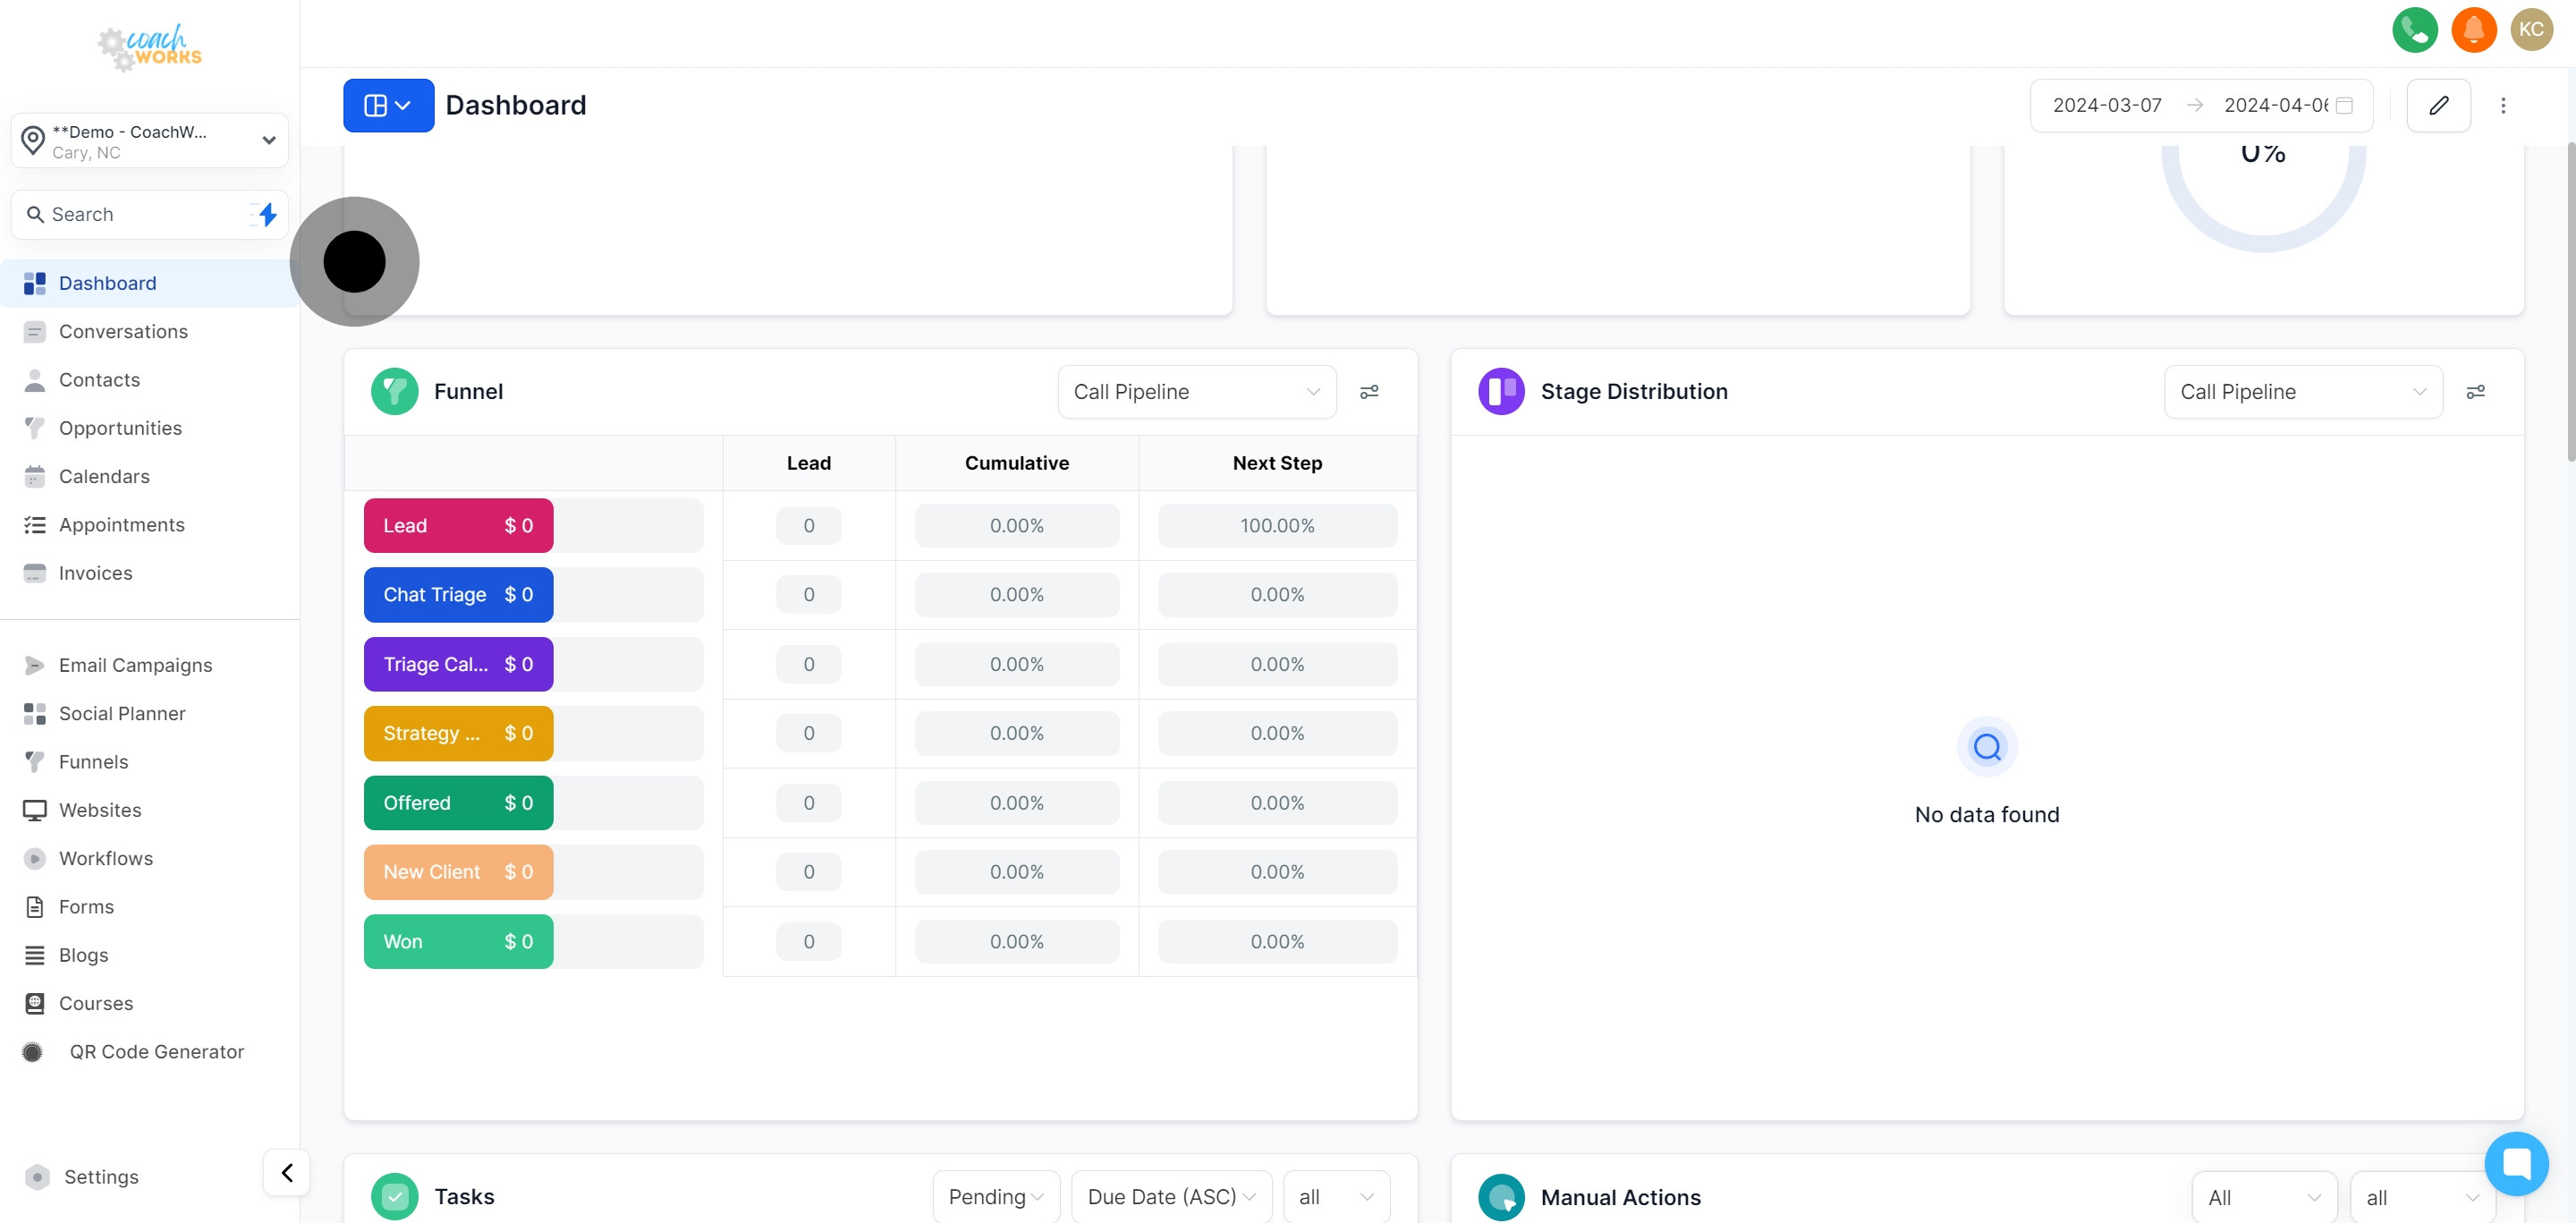
View Stage distribution to analyze the flow of leads through your sales pipeline.
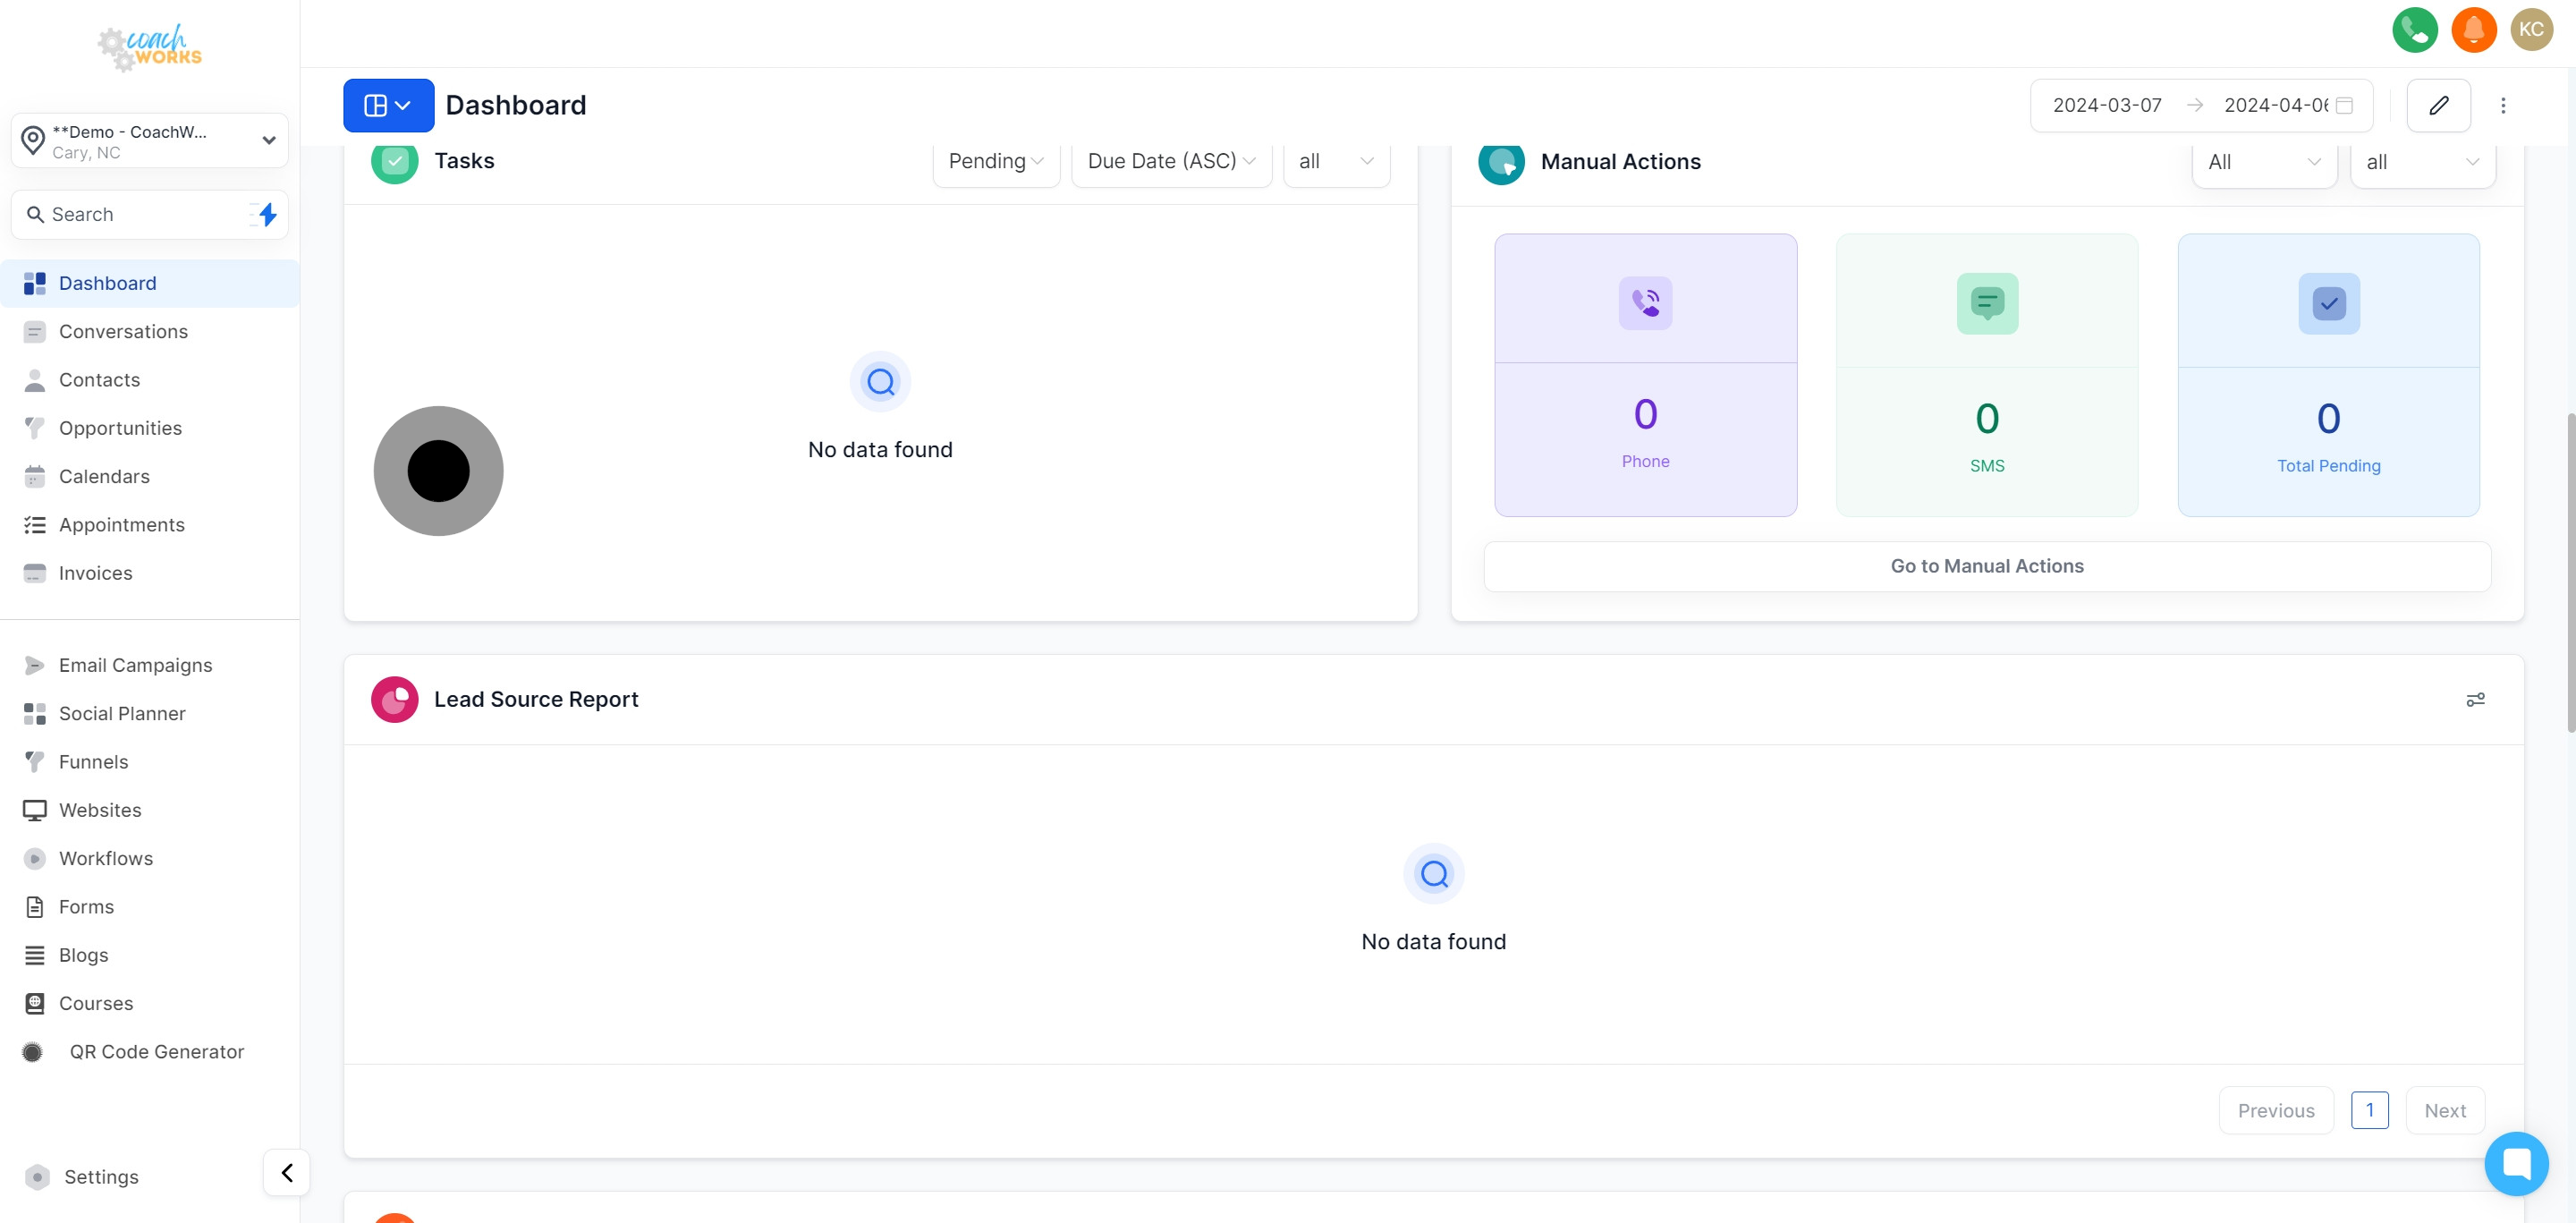
Track your tasks under the "Task" window and manage workflows efficiently.
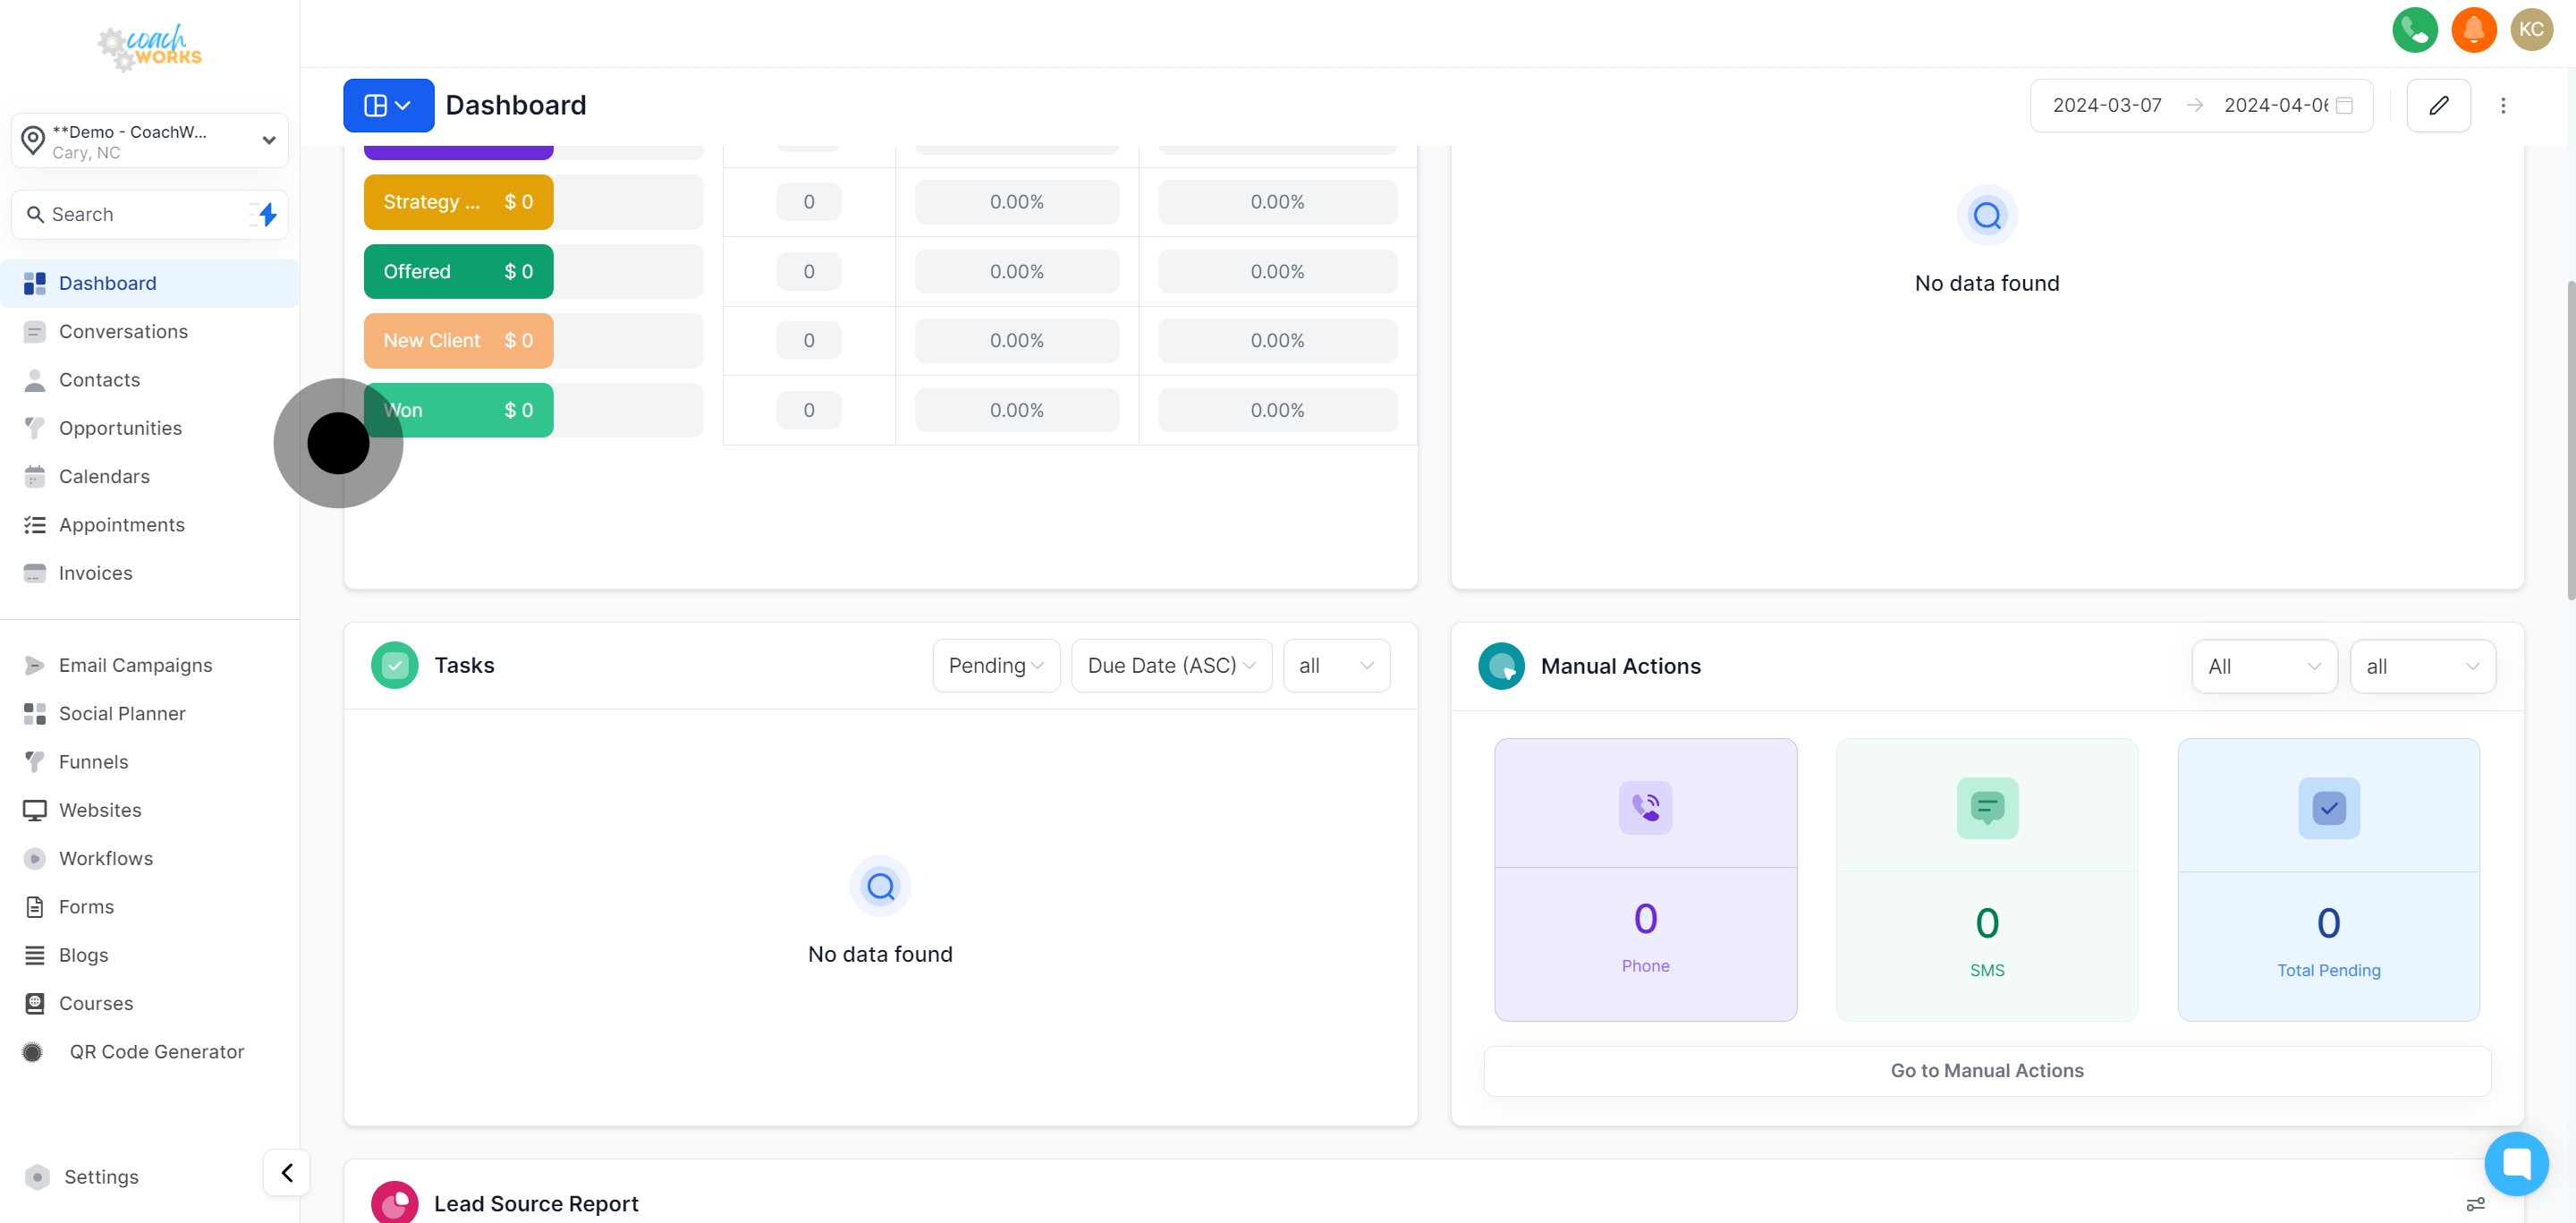
Lastly, access a plethora of reports from lead sources, Google Analytics, Google Business Profile, and valuable Facebook Ads insights to round off your analytics journey.